Good stuff to know
Reality Check: This Is What You Can Actually Afford on Minimum Wage
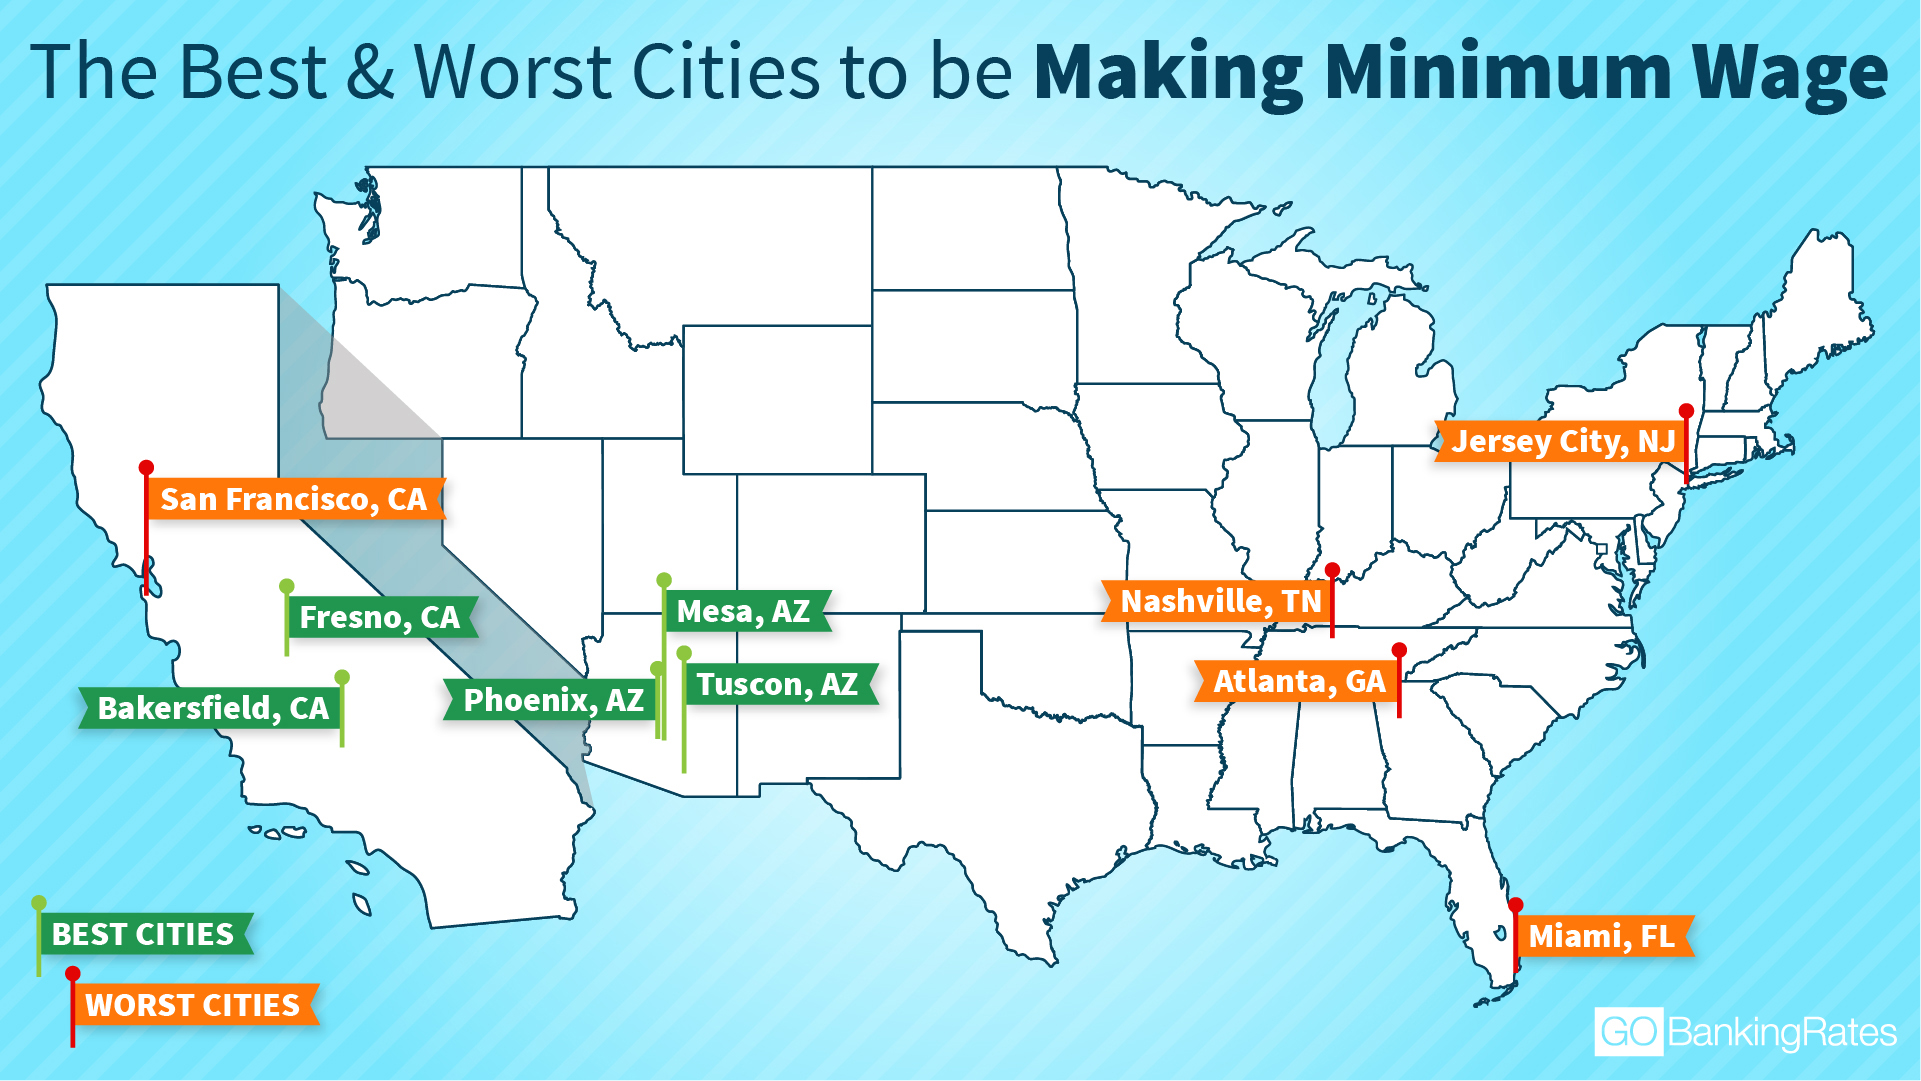
Some interesting and potentially unexpected results ended up bubbling to the surface. The best regions to live are certainly clear: the West, Midwest and the Southwest. About half of the top 25 cities are in the West or Southwest regions, with all six of the top six being in either California or Arizona
Tucson. Mesa and Phoenix got ranked in the top five of the best and worst cities to be making minimum wage:
1. Bakersfield, Calif.
2. Fresno, Calif.
3. Tucson, Ariz.
4. Mesa, Ariz.
5. Phoenix
Methodology: GOBankingRates compiled the list of cities based on the 100 most populous U.S. cities, according to U.S. Census Bureau estimates.
Cities were analyzed based on the following factors:
(1) housing, using the median rent for a one-bedroom apartment in each city, sourced from Zillow’s December 2017 rental index
(2) groceries, using the recommended amount reported by cost-of-living database Numbeo.com for each city
(3) utilities in each city, according to cost estimates from Numbeo.com
(4) transportation cost based on the price of a monthly pass for public transportation, according to cost estimates from Numbeo.com.
Monthly costs were totaled and multiplied by 12 to get the annual cost of necessities in each city. To get yearly salaries, the minimum wage was multiplied by 40 hours a week and by 52 weeks in a year. Each city was also given a livability score (sourced from AreaVibes). They were then ranked to produce a list of the best and worst cities to be making minimum wage.
https://www.gobankingrates.com/making-money/economy/best-worst-cities-minimum-wage-workers/
__________________________________________________________________________________
??
Mesa, Ariz.
Yearly minimum wage: $21,840
Total annual necessities: $15,545
Total annual necessities: $15,545
Percentage of residents living in poverty in 2016: 16.8%
(10.1% for White Non-Hispanic residents,
(10.1% for White Non-Hispanic residents,
27.4% for Black residents,
28.8% for Hispanic or Latino residents,
25.2% for American Indian residents,
14.6% for Native Hawaiian and other Pacific Islander residents,
23.1% for other race residents,
18.8% for two or more races residents)
Read more: http://www.city-data.com/city/Mesa-Arizona.html#ixzz5FnE1Yben
Read more: http://www.city-data.com/city/Mesa-Arizona.html#ixzz5FnE1Yben
Stats + Data from City Data
Median gross rent in 2016: $960.
Daytime population change due to commuting: -52,909 (-10.9%)
Workers who live and work in this city: 84,979 (37.6%)
Workers who live and work in this city: 84,979 (37.6%)
_____________________________________________________________________
Property values in Mesa, AZ


Leaflet | Data, imagery and map information provided by CartoDB, OpenStreetMap and contributors, CC-BY-SA
Read more: http://www.city-data.com/city/Mesa-Arizona.html#ixzz5Fn8vTYma
Here Are the Best and Worst Cities to Be a Minimum Wage Earner
Cities with the highest minimum wage aren't always the best.
by Joel Anderson March 5, 2018


No comments:
Post a Comment