|
International Data
International Transactions, International Services, and International Investment Position Tables
International Data
International Transactions, International Services, and International Investment Position Tables
International Trade in Goods and Services
U.S. International Trade in Goods and Services, May 2025
|
May 2025
|
-$71.5 B
|
|
April 2025
|
-$60.3 B
|
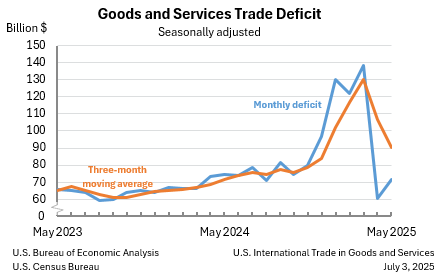
The U.S. goods and services trade deficit increased in May 2025 according to the U.S. Bureau of Economic Analysis and the U.S. Census Bureau. The deficit increased from $60.3 billion in April (revised) to $71.5 billion in May, as exports decreased more than imports. The goods deficit increased $11.2 billion in May to $97.5 billion. The services surplus decreased $0.1 billion in May to $26.0 billion.
- Current Release: July 3, 2025
- Next release: August 5, 2025
U.S. International Trade in Goods and Services, May 2025
What is Trade in Goods and Services?
Trade in goods and services between U.S. residents and residents of other countries each month. U.S. sales are exports and U.S. purchases are imports. The difference between the exports and imports is the trade balance.
International Data
International Transactions, International Services, and International Investment Position Tables
U.S. International Trade in Goods and Services, May 2025
The U.S. goods and services trade deficit increased in May 2025 according to the U.S. Bureau of Economic Analysis and the U.S. Census Bureau. The deficit increased from $60.3 billion in April (revised) to $71.5 billion in May, as exports decreased more than imports. The goods deficit increased $11.2 billion in May to $97.5 billion. The services surplus decreased $0.1 billion in May to $26.0 billion.
U.S. Trade in Services Detailed Tables, 2024
For 2024, U.S. exports of services were $1,152.7 billion, and U.S. imports of services were $840.9 billion. For 2022—the latest year for which statistics are available—services supplied to foreign persons through foreign affiliates of U.S. multinational enterprises (MNEs) were $2,114.1 billion, and services supplied to U.S. persons through U.S. affiliates of foreign MNEs were $1,517.8 billion. Affiliates supplied most of the services provided to foreign persons by the United States and to U.S. persons by foreign markets in 2022.


No comments:
Post a Comment