Saturday, February 12, 2022
Friday, February 11, 2022
GOOD NEWS IN POLITICS: Congress approves bill to end forced arbitration in sexual assault cases
The bill, called the Ending Forced Arbitration of Sexual Assault and Sexual Harassment Act, was passed with a large bipartisan vote by the House of Representatives on Monday and heads to President Biden's desk for his signature.
Congress approves bill to end forced arbitration in sexual assault cases

"The Senate approved legislation banning the practice of using clauses in employment contracts that force victims of sexual assault and harassment to pursue their cases in forced arbitration, which shields accused perpetrators.
Sen. Kirstin Gillibrand, D-N.Y., and Sen. Lindsey Graham, R-S.C., introduced the bill five years ago and lawmakers negotiated with business leaders to get support for the bill. In a sign of the overwhelming support for the measure, it was approved by voice vote in the chamber...
The bill gives individuals a choice between going to court or going to arbitration to resolve allegations in cases related to sexual harassment or assault. The measure is also retroactive — invalidating any existing forced arbitration clauses in ongoing cases that could make it difficult for any survivors to litigate cases against their employers.
Gillibrand said this bill represents "one of the most significant workplace reforms in history." She said estimates indicate about 60 million Americans are subject to these clauses.
"No more arbitration in the basement about misconduct up top," Graham said. He predicted that corporate America will "up their game" and adopt new practices as a result of the bill.
Gretchen Carlson, the former Fox News anchor who accused Roger Ailes, the then CEO of the news outlet, of sexual harassment more than five years ago, learned the clause forcing arbitration was in her contract. She pursued litigation against Ailes personally and won a settlement, but has been part of the effort to press Congress to change the law. . ."
READ MORE:
LATE-NIGHT GUY TALK. . .Go Natural "It’s a new day. A little bit of hair is fine!” | HuffPost
In a Wednesday appearance on “Jimmy Kimmel Live!,” the actor said he plans to forgo body waxing for his forthcoming role in “Magic Mike’s Last Dance” in an effort to reflect current tastes in male grooming.
Channing Tatum Says He Won't Be Waxing For Third 'Magic Mike' Movie
Speaking to Jimmy Kimmel, the actor said he and his co-stars may "go natural" when they return for a third installment of the male stripper franchise.

BEA News: U.S. International Trade in Goods and Services, December 2021 (08 Feb 2022)

BEA News: U.S. International Trade in Goods and Services, December 2021
The U.S. Bureau of Economic Analysis (BEA) has issued the following news release today:
========================================================================
News Release
U.S. International Trade in Goods and Services, December 2021
The U.S. Census Bureau and the U.S. Bureau of Economic Analysis announced today that the goods and services deficit was $80.7 billion in December, up $1.4 billion from $79.3 billion in November, revised.
| Deficit: | $80.7 Billion | +1.8%° |
| Exports: | $228.1 Billion | +1.5%° |
| Imports: | $308.9 Billion | +1.6%° |
Next release: Tuesday, March 8, 2022 (°) Statistical significance is not applicable or not measurable. Data adjusted for seasonality but not price changes Source: U.S. Census Bureau, U.S. Bureau of Economic Analysis; U.S. International Trade in Goods and Services, The 2021 increase in the goods and services deficit reflected an increase in the goods deficit of $168.7 billion, or 18.3 percent, to $1,090.7 billion and a decrease in the services surplus of $13.8 billion, or 5.6 percent, to $231.5 billion. The goods and services deficit was 3.7 percent of current-dollar gross domestic product in 2021, up from 3.2 percent in 2020. Exports (exhibits 3, 6, and 7) Exports of goods increased $333.2 billion to $1,762.0 billion in 2021. Exports of goods on a Census basis increased $329.6 billion.
Net balance of payments adjustments increased $3.5 billion. Exports of services increased $60.9 billion to $766.6 billion in 2021.
Imports (exhibits 4, 6, and 8) Imports of goods increased $501.8 billion to $2,852.6 billion in 2021. Imports of goods on a Census basis increased $497.0 billion.
Net balance of payments adjustments increased $4.9 billion. Imports of services increased $74.7 billion to $535.0 billion in 2021.
Goods by Selected Countries and Areas – Census Basis (exhibits 14 and 14a) The 2021 figures show surpluses, in billions of dollars, with South and Central America ($53.6), Hong Kong ($25.8), Netherlands ($18.2), Brazil ($15.6), Australia ($14.0), and Belgium ($12.7). Deficits were recorded, in billions of dollars, with China ($355.3), European Union ($219.6), Mexico ($108.2), Germany ($70.1), Japan ($60.2), Ireland ($60.2), Canada ($49.5), Malaysia ($41.0), Taiwan ($40.2), Italy ($39.3), Switzerland ($39.0), Thailand ($34.7), India ($33.1), South Korea ($29.2), Russia ($23.3), France ($20.3), and Indonesia ($17.6).
* * * All statistics referenced are seasonally adjusted; statistics are on a balance of payments basis unless otherwise specified. Additional statistics, including not seasonally adjusted statistics and details for goods on a Census basis, are available in exhibits 1-20b of this release. For information on data sources, definitions, and revision procedures, see the explanatory notes in this release. The full release can be found at www.census.gov/foreign-trade/Press-Release/current_press_release/index.html or www.bea.gov/data/intl-trade-investment/international-trade-goods-and-services. The full schedule is available in the Census Bureau’s Economic Briefing Room at www.census.gov/economic-indicators/ or on BEA’s website at www.bea.gov/news/schedule. | ||
Exports, Imports, and Balance (exhibit 1)
December exports were $228.1 billion, $3.4 billion more than November exports. December imports were $308.9 billion, $4.8 billion more than November imports.
The December increase in the goods and services deficit reflected an increase in the goods deficit of $3.2 billion to $101.4 billion and an increase in the services surplus of $1.8 billion to $20.7 billion.
For 2021, the goods and services deficit increased $182.4 billion, or 27.0 percent, from 2020. Exports increased $394.1 billion or 18.5 percent. Imports increased $576.5 billion or 20.5 percent.
The global pandemic and the economic recovery continued to impact international trade in December 2021 and throughout the year. The full economic effects of the pandemic cannot be quantified in the statistics because the impacts are generally embedded in source data and cannot be separately identified.
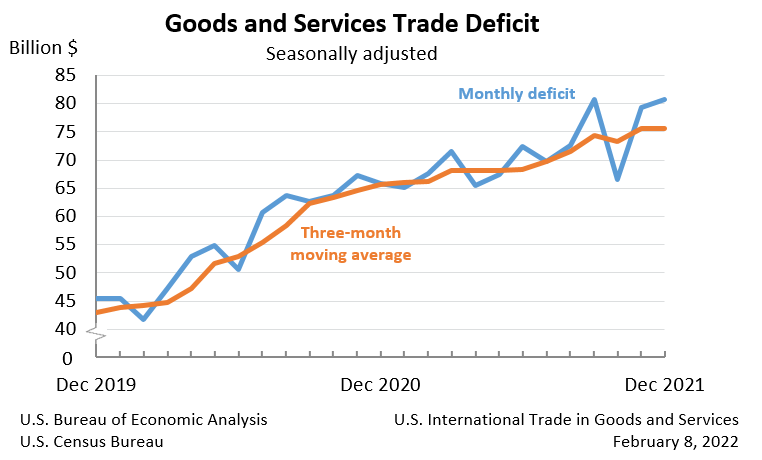
Three-Month Moving Averages (exhibit 2)
The average goods and services deficit decreased less than $0.1 billion to $75.5 billion for the three months ending in December.
- Average exports increased $7.1 billion to $225.6 billion in December.
- Average imports increased $7.0 billion to $301.2 billion in December.
Year-over-year, the average goods and services deficit increased $9.9 billion from the three months ending in December 2020.
- Average exports increased $39.4 billion from December 2020.
- Average imports increased $49.3 billion from December 2020.
Exports (exhibits 3, 6, and 7)
Exports of goods increased $2.0 billion to $158.3 billion in December.
Exports of goods on a Census basis increased $2.2 billion.
- Consumer goods increased $1.2 billion.
- Pharmaceutical preparations increased $1.0 billion.
- Capital goods increased $0.9 billion.
- Civilian aircraft engines increased $0.6 billion.
- Automotive vehicles, parts, and engines increased $0.8 billion.
- Passenger cars increased $0.8 billion.
- Industrial supplies and materials increased $0.5 billion.
- Nonmonetary gold increased $1.2 billion.
- Natural gas liquids decreased $0.6 billion.
- Foods, feeds, and beverages decreased $1.1 billion.
- Soybeans decreased $0.5 billion.
Net balance of payments adjustments decreased $0.2 billion.
Exports of services increased $1.4 billion to $69.9 billion in December.
- Transport increased $0.6 billion.
- Travel increased $0.5 billion.
Imports (exhibits 4, 6, and 8)
Imports of goods increased $5.2 billion to $259.7 billion in December.
Imports of goods on a Census basis increased $5.3 billion.
- Consumer goods increased $5.2 billion.
- Cell phones and other household goods increased $2.4 billion.
- Toys, games, and sporting goods increased $1.0 billion.
- Household appliances increased $0.6 billion.
- Automotive vehicles, parts, and engines increased $2.4 billion.
- Passenger cars increased $1.4 billion.
- Other automotive parts and accessories increased $0.6 billion.
- Capital goods increased $2.3 billion.
- Telecommunications equipment increased $0.6 billion.
- Computers increased $0.5 billion.
- Industrial supplies and materials decreased $3.2 billion.
- Crude oil decreased $1.3 billion.
- Finished metal shapes decreased $0.7 billion.
- Fertilizers, pesticides, and insecticides decreased $0.7 billion.
Net balance of payments adjustments decreased $0.2 billion.
Imports of services decreased $0.4 billion to $49.2 billion in December.
- Travel decreased $0.5 billion.
- Transport increased $0.1 billion.
Real Goods in 2012 Dollars – Census Basis (exhibit 11)
The real goods deficit increased $1.3 billion to $111.2 billion in December.
- Real exports of goods increased $4.8 billion to $153.7 billion.
- Real imports of goods increased $6.0 billion to $264.9 billion.
Revisions
In addition to revisions to source data for the November statistics, the seasonally adjusted goods data were revised for January through November so that the totals of the seasonally adjusted months equal the annual totals.
Revisions to November exports
- Exports of goods were revised up $0.3 billion.
- Exports of services were revised up $0.2 billion.
Revisions to November imports
- Imports of goods were revised down $0.4 billion.
- Imports of services were revised up $0.1 billion.
Goods by Selected Countries and Areas: Monthly – Census Basis (exhibit 19)
The December figures show surpluses, in billions of dollars, with South and Central America ($5.4), Hong Kong ($1.9), Brazil ($1.2), Singapore ($0.8), and United Kingdom ($0.6). Deficits were recorded, in billions of dollars, with China ($34.1), European Union ($16.3), Mexico ($11.0), Germany ($5.3), Japan ($5.0), Canada ($4.2), India ($3.9), Taiwan ($3.8), South Korea ($3.7), Italy ($3.1), France ($0.8), and Saudi Arabia ($0.7).
- The deficit with China increased $6.0 billion to $34.1 billion in December. Exports decreased $2.2 billion to $11.8 billion and imports increased $3.8 billion to $45.9 billion.
- The deficit with South Korea increased $1.4 billion to $3.7 billion in December. Exports decreased $0.9 billion to $4.8 billion and imports increased $0.5 billion to $8.5 billion.
- The deficit with the European Union decreased $3.0 billion to $16.3 billion in December. Exports increased $0.7 billion to $25.1 billion and imports decreased $2.4 billion to $41.4 billion.
Annual Summary for 2021
Exports, Imports, and Balance (exhibit 1)
For 2021, the goods and services deficit was $859.1 billion, up $182.4 billion from $676.7 billion in 2020. Exports were $2,528.5 billion, up $394.1 billion from 2020. Imports were $3,387.7 billion, up $576.5 billion from 2020.
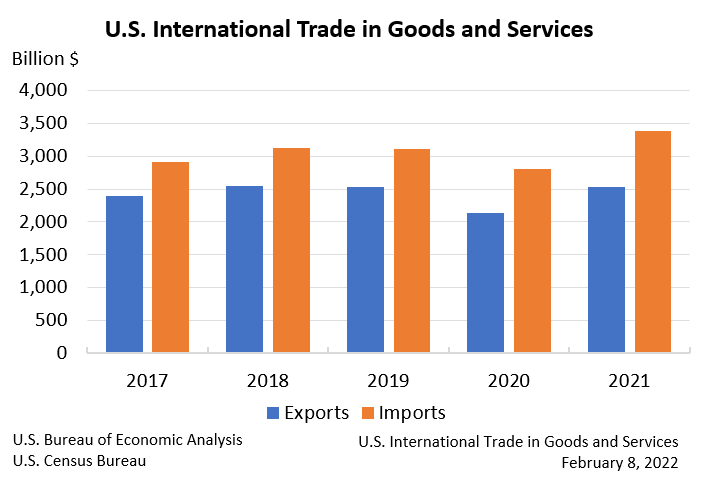
The 2021 increase in the goods and services deficit reflected an increase in the goods deficit of $168.7 billion, or 18.3 percent, to $1,090.7 billion and a decrease in the services surplus of $13.8 billion, or 5.6 percent, to $231.5 billion.
The goods and services deficit was 3.7 percent of current-dollar gross domestic product in 2021, up from 3.2 percent in 2020.
Exports (exhibits 3, 6, and 7)
Exports of goods increased $333.2 billion to $1,762.0 billion in 2021.
Exports of goods on a Census basis increased $329.6 billion.
- Industrial supplies and materials increased $169.6 billion.
- Other petroleum products increased $25.2 billion.
- Natural gas increased $21.2 billion.
- Crude oil increased $19.9 billion.
- Capital goods increased $59.3 billion.
- Other industrial machinery increased $11.1 billion.
- Semiconductors increased $11.0 billion.
- Civilian aircraft increased $7.7 billion.
- Consumer goods increased $47.3 billion.
- Pharmaceutical preparations increased $24.1 billion.
- Cell phones and other household goods increased $5.9 billion.
- Gem diamonds increased $5.0 billion.
- Foods, feeds, and beverages increased $25.9 billion.
- Automotive vehicles, parts, and engines increased $15.7 billion.
Net balance of payments adjustments increased $3.5 billion.
Exports of services increased $60.9 billion to $766.6 billion in 2021.
- Other business services increased $26.8 billion.
- Financial services increased $17.7 billion.
Imports (exhibits 4, 6, and 8)
Imports of goods increased $501.8 billion to $2,852.6 billion in 2021.
Imports of goods on a Census basis increased $497.0 billion.
- Industrial supplies and materials increased $169.7 billion.
- Crude oil increased $56.3 billion.
- Other petroleum products increased $18.2 billion.
- Iron and steel mill products increased $14.2 billion.
- Consumer goods increased $126.8 billion.
- Cell phones and other household goods increased $22.9 billion.
- Toys, games, and sporting goods increased $16.7 billion.
- Cotton apparel and household goods increased $11.3 billion.
- Capital goods increased $117.5 billion.
- Electric apparatus increased $16.2 billion.
- Computer accessories increased $12.9 billion.
- Medical equipment increased $12.3 billion.
- Semiconductors increased $11.1 billion.
- Automotive vehicles, parts, and engines increased $36.8 billion.
- Other automotive parts and accessories increased $20.8 billion.
- Foods, feeds, and beverages increased $27.8 billion.
Net balance of payments adjustments increased $4.9 billion.
Imports of services increased $74.7 billion to $535.0 billion in 2021.
- Transport increased $32.1 billion.
- Travel increased $22.0 billion.
Goods by Selected Countries and Areas – Census Basis (exhibits 14 and 14a)
> The 2021 figures show surpluses, in billions of dollars, with South and Central America ($53.6), Hong Kong ($25.8), Netherlands ($18.2), Brazil ($15.6), Australia ($14.0), and Belgium ($12.7).
> Deficits were recorded, in billions of dollars, with China ($355.3), European Union ($219.6), Mexico ($108.2), Germany ($70.1), Japan ($60.2), Ireland ($60.2), Canada ($49.5), Malaysia ($41.0), Taiwan ($40.2), Italy ($39.3), Switzerland ($39.0), Thailand ($34.7), India ($33.1), South Korea ($29.2), Russia ($23.3), France ($20.3), and Indonesia ($17.6).
- The deficit with China increased $45.0 billion to $355.3 billion in 2021. Exports increased $26.6 billion to $151.1 billion and imports increased $71.6 billion to $506.4 billion.
- The deficit with the European Union increased $35.4 billion to $219.6 billion in 2021. Exports increased $40.4 billion to $271.6 billion and imports increased $75.8 billion to $491.3 billion.
- The deficit with Switzerland decreased $17.8 billion to $39.0 billion in 2021. Exports increased $5.9 billion to $24.0 billion and imports decreased $11.9 billion to $63.0 billion.
* * *
All statistics referenced are seasonally adjusted; statistics are on a balance of payments basis unless otherwise specified. Additional statistics, including not seasonally adjusted statistics and details for goods on a Census basis, are available in exhibits 1-20b of this release.
For information on data sources, definitions, and revision procedures, see the explanatory notes in this release. The full release can be found at www.census.gov/foreign-trade/Press-Release/current_press_release/index.html or www.bea.gov/data/intl-trade-investment/international-trade-goods-and-services.
The full schedule is available in the Census Bureau’s Economic Briefing Room at www.census.gov/economic-indicators/ or on BEA’s website at www.bea.gov/news/schedule.
RAPID INFLATION EXCEEDING FORECASTS | NY Times
Intro: A key inflation measure released on Thursday showed that prices are climbing at the fastest pace in 40 years and broadening to touch nearly every corner of the American economy, heightening the risk that they will stay elevated for longer and that policymakers may have to react more aggressively.
Rapid Inflation Stokes Unease From Wall Street to Washington
Consumer Price Index data showed prices climbing faster than expected, picking up across a broad array of goods and services
(Note: Does not include food and energy)

Jeanna Smialek and

-
 Flash News: Ukraine Intercepts Russian Kh-59 Cruise Missile Using US VAMPIRE Air Defense System Mounted on Boat. Ukrainian forces have made ...

