Watch: DOGE Is Not 'Tinkering' With Payments, says Treasury Secretary Bessent


Watch: DOGE Is Not 'Tinkering' With Payments, says Treasury Secretary Bessent
Eventually you get "The Terminator' __________________________________________
In this episode, Musk explores the intersection of advanced technology and modern warfare, focusing on the role of AI and drones in transforming the battlefield.
He shares his insights on innovation, the existential risks of AI, and the future of autonomous systems in military operations.
Musk’s unique perspective offers invaluable lessons for military and industry leaders, and anyone interested in the future of warfare technology.
(This episode was created from Mr. Musk’s visit to West Point in August, where he conducted a fireside chat with BG Shane Reeves as part of the Academy’s launch of its newest annual theme, “The Human and The Machine: Leadership on The Emerging Battlefield.”
This year’s theme aligns education with the future battlefield, preparing cadets for emerging challenges to ensure that our military is the most lethal and effective in the world.)
This story is from MovieMaker’s Winter 2025 issue, on newsstands now with additional images.

"Mickey 17, director Bong Joon Ho’s follow-up to the triumph of his 2019 film Parasite, is the story of a man named Mickey Barnes — played by Pattinson — selected to perform unpleasant tasks on the alien planet of Niflheim. He dies in a series of mishaps, and is brought back again and again through a process called “reprinting.”
Pattinson says constant accidents came naturally.
“I was quite comfortable with stunts in Mickey 17 because I could look bad while falling over,” he explains. “For some reason, that’s the one benefit of being quite mal-coordinated. Somehow I don’t really hurt myself that much from just falling. … I think falling down is my safe space.”
...So take Pattinson’s claim of clumsiness with a grain of salt, and appreciation for his dry wit. But it’s also true that making movies almost always involves things going wrong, then getting better.
And when Bong Joon Ho is involved, they often turn out great.
The South Korean director immediately related to Mickey7, the bestselling Edward Ashton novel upon which Mickey 17 is based.

In some ways, one might expect Mickey 17 to be even more successful. Though Bong urged audiences in one of his Parasite acceptance speeches to “overcome the one-inch tall barrier of subtitles,” he has made Mickey 17
more accessible to American moviegoers by making it in English, and has
cast one of the world’s biggest movie stars in the lead role.
> The industry is ready for a rebirth. Or maybe several.
But however Mickey 17 fares, Pattinson loved the process of making it. Even the falls.
“Bong made it seem really simple and fun,” he says. “It was one of the most enjoyable jobs I’ve ever gone on because I was literally just doing stuff to make him laugh most of the time. I just acted like a jester, trusting that Bong’s steering the ship in the right direction.”

Nothing in Mickey 17 is blatant — Bong’s films thrill in part because they so skillfully comingle genre, philosophy and charm. But you could read the film as a protest against the cheapening of life, work and art.
 Robert Pattinson in Mickey 17. Warner Bros.
. . .But Mickey 17 isn’t just about respect for human life.
In Ashton’s novel, Niflheim is inhabited by grotesque insects called Creepers that look something like centipedes. And some characters in Mickey 17 also see them as repulsive.

The U.S. Bureau of Economic Analysis (BEA) has issued the following news release today:
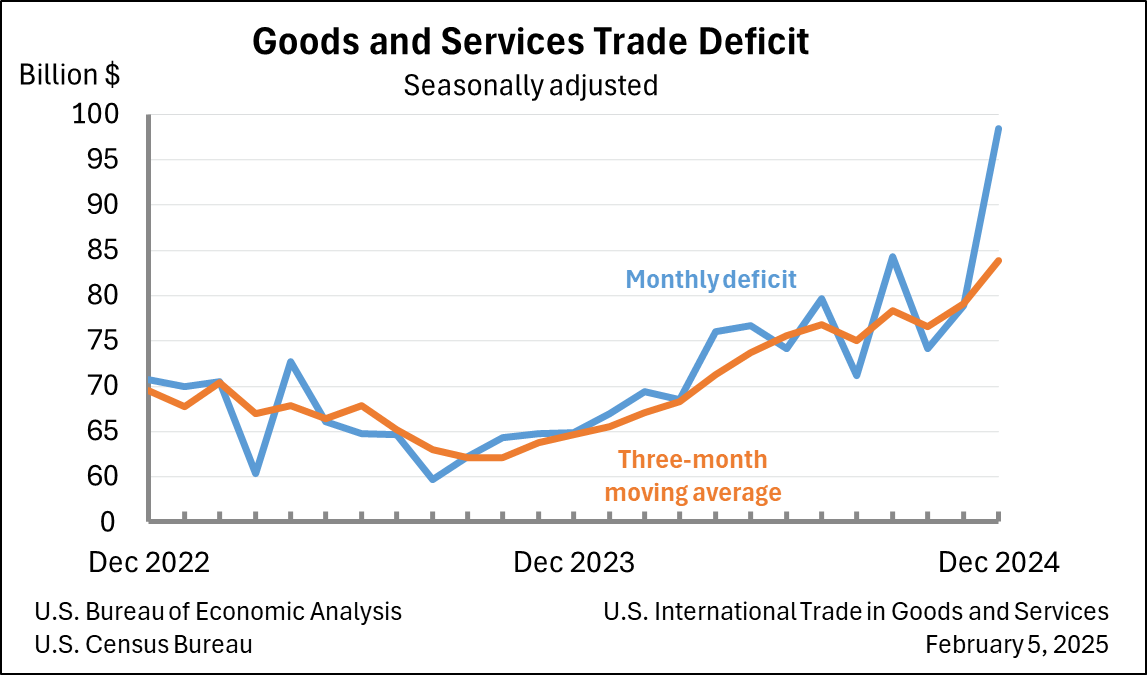
The U.S. monthly international trade deficit increased in December 2024 according to the U.S. Bureau of Economic Analysis and the U.S. Census Bureau. The deficit increased from $78.9 billion in November (revised) to $98.4 billion in December, as imports increased and exports decreased. The goods deficit increased $18.9 billion in December to $123.0 billion. The services surplus decreased $0.6 billion in December to $24.5 billion.
The full text of the release can be found at www.bea.gov/news/2025/us-
The U.S. Census Bureau and the U.S. Bureau of Economic Analysis announced today that the goods and services deficit was $98.4 billion in December, up $19.5 billion from $78.9 billion in November, revised.
| Deficit: | $98.4 Billion | +24.7%° |
| Exports: | $266.5 Billion | –2.6%° |
| Imports: | $364.9 Billion | +3.5%° |
|
Next release: Thursday, March 6, 2025 (°) Statistical significance is not applicable or not measurable. Data adjusted for seasonality but not price changes Source: U.S. Census Bureau, U.S. Bureau of Economic Analysis; U.S. International Trade in Goods and Services, February 5, 2025 |
||
Exports, Imports, and Balance (exhibit 1)
December exports were $266.5 billion, $7.1 billion less than November exports. December imports were $364.9 billion, $12.4 billion more than November imports.
The December increase in the goods and services deficit reflected an increase in the goods deficit of $18.9 billion to $123.0 billion and a decrease in the services surplus of $0.6 billion to $24.5 billion.
For 2024, the goods and services deficit increased $133.5 billion, or 17.0 percent, from 2023. Exports increased $119.8 billion or 3.9 percent. Imports increased $253.3 billion or 6.6 percent.
Three-Month Moving Averages (exhibit 2)
The average goods and services deficit increased $4.7 billion to $83.8 billion for the three months ending in December.
Year-over-year, the average goods and services deficit increased $19.2 billion from the three months ending in December 2023.
Exports (exhibits 3, 6, and 7)
Exports of goods decreased $7.5 billion to $170.2 billion in December.
Exports of goods on a Census basis decreased $6.7 billion.
Net balance of payments adjustments decreased $0.8 billion.
Exports of services increased $0.4 billion to $96.3 billion in December.
Imports (exhibits 4, 6, and 8)
Imports of goods increased $11.4 billion to $293.1 billion in December.
Imports of goods on a Census basis increased $11.3 billion.
Net balance of payments adjustments increased $0.1 billion.
Imports of services increased $1.0 billion to $71.8 billion in December.
Real Goods in 2017 Dollars – Census Basis (exhibit 11)
The real goods deficit increased $14.9 billion, or 15.4 percent, to $111.9 billion in December, compared to a 17.3 percent increase in the nominal deficit.
Revisions
In addition to revisions to source data for the November statistics, the seasonally adjusted goods data were revised for January through November so that the totals of the seasonally adjusted months equal the annual totals.
Revisions to November exports
Revisions to November imports
Goods by Selected Countries and Areas: Monthly – Census Basis (exhibit 19)
The December figures show surpluses, in billions of dollars, with
Annual Summary for 2024
Exports, Imports, and Balance (exhibit 1)
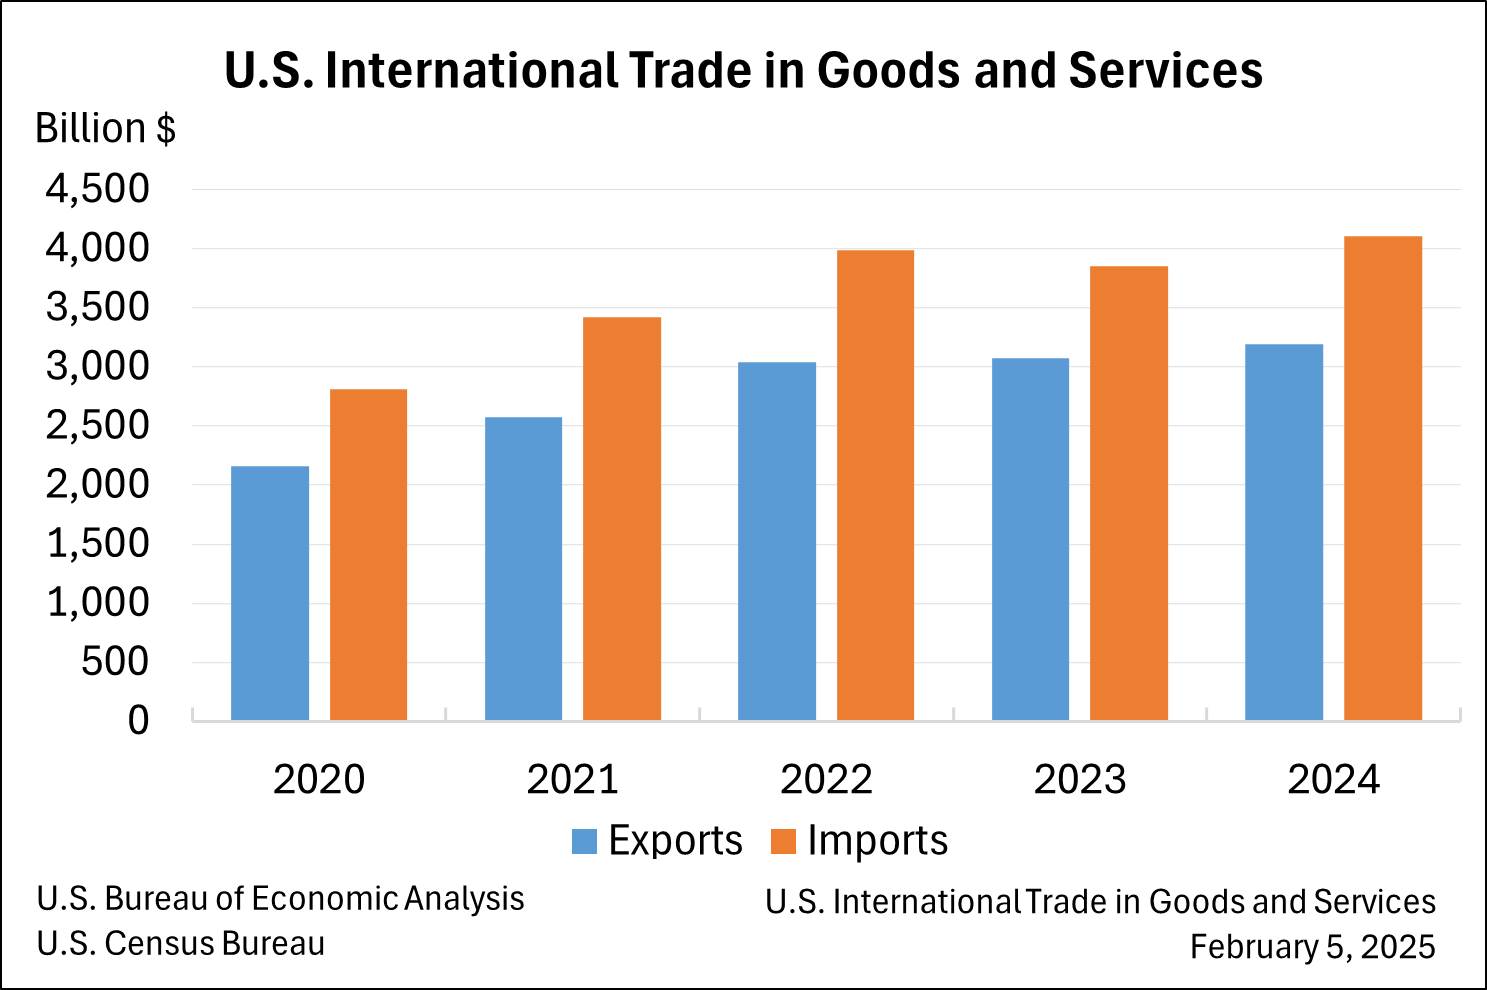
The 2024 increase in the goods and services deficit reflected an increase in the goods deficit of $148.5 billion, or 14.0 percent, to $1,211.7 billion and an increase in the services surplus of $14.9 billion, or 5.4 percent, to $293.3 billion.
The goods and services deficit was 3.1 percent of current-dollar gross domestic product in 2024, up from 2.8 percent in 2023.
Exports of goods increased $38.6 billion to $2,083.8 billion in 2024.
Exports of goods on a Census basis increased $47.1 billion.
Net balance of payments adjustments decreased $8.5 billion.
Exports of services increased $81.2 billion to $1,107.8 billion in 2024.
Imports of goods increased $187.1 billion to $3,295.6 billion in 2024.
Imports of goods on a Census basis increased $187.2 billion.
Net balance of payments adjustments decreased $0.2 billion.
Imports of services increased $66.2 billion to $814.4 billion in 2024.
The real goods deficit increased $98.8 billion, or 9.6 percent, to $1,132.4 billion in 2024, compared to a 13.2 percent increase in the nominal deficit.
Goods by Selected Countries and Areas – Census Basis (exhibits 14 and 14a)
The 2024 figures show surpluses, in billions of dollars, with Netherlands ($55.5), South and Central America ($47.3), Hong Kong ($21.9), Australia ($17.9), and United Kingdom ($11.9). Deficits were recorded, in billions of dollars, with China ($295.4), European Union ($235.6), Mexico ($171.8), Vietnam ($123.5), Ireland ($86.7), Germany ($84.8), Taiwan ($73.9), Japan ($68.5), South Korea ($66.0), Canada ($63.3), India ($45.7), Thailand ($45.6), Italy ($44.0), Switzerland ($38.5), Malaysia ($24.8), Indonesia ($17.9), France ($16.4), Austria ($13.1), and Sweden ($9.8).
All statistics referenced are seasonally adjusted; statistics are on a balance of payments basis unless otherwise specified. Additional statistics, including not seasonally adjusted statistics and details for goods on a Census basis, are available in exhibits 1-20b of this release. For information on data sources, definitions, and revision procedures, see the explanatory notes in this release. The full release can be found at www.census.gov/foreign-trade/Press-Release/current_press_release/index.html or www.bea.gov/data/intl-trade-investment/international-trade-goods-and-services. The full schedule is available in the Census Bureau’s Economic Briefing Room at www.census.gov/economic-indicators/ or on BEA’s website at www.bea.gov/news/schedule.
Next release: March 6, 2025, at 8:30 a.m EST
U.S. International Trade in Goods and Services, January 2025
Impact of Canada Border Services Agency’s (CBSA) Release of CBSA Assessment and Revenue Management (CARM)
The CBSA introduced a new accounting system (CARM) on October 21, 2024. As a result, importers in Canada have experienced delays in filing shipment information. These delays affected the compilation of statistics on U.S. exports of goods to Canada for September through December 2024, which are derived from data compiled by Canada through the United States - Canada Data Exchange. A dollar estimate of the filing backlog is included in estimates for late receipts and, following the Census Bureau’s customary practice for late receipt estimates, is included in the export end-use category “Other goods” as well as in exports to Canada. This estimate will be replaced with the actual transactions reported by the Harmonized System classification in June 2025 with the release of “U.S. International Trade in Goods and Services, Annual Revision.” Until then, please refer to the supplemental spreadsheet “CARM Exports to Canada Corrections,” which provides a breakdown of the late receipts by 1-digit end-use category. This spreadsheet will be updated as late export transactions are received to reflect reassignments from the initial “Other goods” category to the appropriate 1-digit end-use category.
If you have questions or need additional information, please contact the Census Bureau, Economic Indicators Division, International Trade Macro Analysis Branch, on 800-549-0595, option 4, or at eid.international.trade.data@census.gov or BEA, Balance of Payments Division, at InternationalAccounts@bea.gov.
Upcoming Changes to the Real (Chained-Dollar) Series
Effective with the release of the February 2025 statistics on April 3, 2025, the Census Bureau will continue to use the Bureau of Labor Statistics (BLS) U.S. Import and Export Price Indexes to calculate the chained-dollar series (exhibits 10 and 11). The BLS will be implementing changes to the indexes with the release of the February 2025 U.S. Import and Export Price Indexes on March 18, 2025. The changes to the indexes could impact the chained-dollar values. Please refer to the BLS notice for additional information on the Upcoming Change to Data Source for Import and Export Price Indexes: U.S. Bureau of Labor Statistics.
If you have any questions or need additional information, please contact the Census Bureau, Economic Statistical Methods Division, International Trade Statistical Methods Branch, on 301-763-3080.


