Friday, October 06, 2017

JUST BULL > Be smart: Worry | Ultra-Loose Money Policy

A Bull Market in everything > Flush with ca$h  
Asset prices are high across the board. Is it time to worry?
That's the cover story published by The Economist sent in the daily batch of news/information pieces from axios.com.
Where’s the beef?
 
 
Asset-price booms are a source of cheer, but also anxiety.
There are two immediate reasons to worry:
1. Markets have been steadily rising against a backdrop of extraordinarily loose monetary policy:
2. Signs are appearing that fund managers-desperate for higher yields-are becoming increasingly incurious
Beware of the bull > “this time is different”. It would be daft to assume that asset prices must remain high come what may. Many hazards could derail the economy and financial markets ...
READ MORE >>

Sunday, October 01, 2017

Area Development Report for 2017

This is the seventh year that Area Development has presented its 100 Leading Locations feature:
Leading Metro MSA Locations for 2017

Some 394 metropolitan statistical areas (MSAs) were ranked based on their performance in four key categories:
“Prime Workforce,”
“Economic Strength,”
“Year-Over-Year Growth"
"Five-Year Growth"
Area Development’s research desk compiled the statistics for this report. Locations were ranked according to the methodology explained herein.
This article was written by Mark Crawford, Staff Editor
These factors are, of course, all interconnected and ideally self-supporting. For example, a top-place ranking in five-year growth is often the result of positive performance in prime workforce, year-over-year economic growth, and economic strength. Larger, “big-city” MSAs tend to perform better overall than mid-size and small communities, simply because of their economic diversity and scale. They also tend to attract more worker inflow because of the opportunities and variety of lifestyles they provide
Phoenix-Mesa-Scottsdale, AZ
2017 Overall Rank: 199
2017 Midterm Growth Rank: 2222017
Economic Strength Rank: 219
Prime Workforce Rank: 143
Year-Over-Year Growth Rank: 152
Ultimately, diversity is the key for long-term growth that can offer high-paying jobs and weather economic tides.
READ MORE > takes a while to load with interactive maps for every category


PERSONAL INCOME AND OUTLAYS, AUGUST 2017

Image result for PERSONAL INCOME AND OUTLAYS, AUGUST 2017
EMBARGOED UNTIL RELEASE AT 8:30 A.M. EDT, Friday, September 29, 2017
PERSONAL INCOME AND OUTLAYS, AUGUST 2017
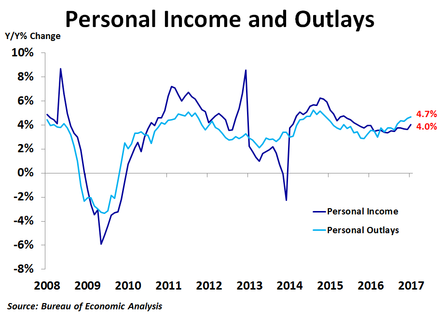
Personal income increased $28.6 billion (0.2 percent) in August according to estimates released today by the Bureau of Economic Analysis.
> Disposable personal income (DPI) increased $14.9 billion (0.1 percent) and personal consumption expenditures (PCE) increased $18.0 billion (0.1 percent).
> Real DPI decreased 0.1 percent in August and Real PCE decreased 0.1 percent.
> The PCE price index increased 0.2 percent. Excluding food and energy, the PCE price index increased 0.1 percent.

                                                                2017
                                                Apr.    May     June    July    Aug.
                                                Percent change from preceding month
Personal income:
Current dollars                                0.1     0.3     0.0     0.3     0.2
Disposable personal income:
Current dollars                                0.2     0.4     0.0     0.2     0.1
Chained (2009) dollars                         0.0     0.5     0.0     0.1    -0.1
Personal consumption expenditures (PCE):
Current dollars                                0.3     0.2     0.1     0.3     0.1
Chained (2009) dollars                         0.1     0.3     0.1     0.2    -0.1
Price indexes:
PCE                                            0.2    -0.1     0.0     0.1     0.2
PCE, excluding food and energy                 0.2     0.1     0.1     0.1     0.1

Price indexes:                                 Percent change from month one year ago
PCE                                            1.7     1.5     1.4     1.4     1.4
PCE, excluding food and energy                 1.6     1.5     1.5     1.4     1.3

> The increase in personal income in August primarily reflected an increase in government social benefits to persons and compensation of employees (table 3).
> Real PCE spending in August decreased $8.4 billion due to a decrease of $20.2 billion in spending for goods that was partially offset by a $9.2 billion increase in spending for services (table 7).
> Within goods, spending on new motor vehicles was the leading contributor to the decrease.
> Within services, healthcare spending was the leading contributor to the increase.
 
Detailed information on monthly real PCE spending can be found on Table 2.3.6U.

Personal outlays increased $16.8 billion in August (table 3).
Image result for PERSONAL INCOME AND OUTLAYS, AUGUST 2017
Personal saving was $522.9 billion in August and the personal saving rate, personal saving as a percentage of disposable personal income, was 3.6 percent (table 1).

Updates

Estimates have been updated for April through July. The change from the preceding month for current-dollar personal income and for current-dollar and chained (2009) dollar DPI and PCE -- revised and previously published -- are shown below for June and July.

                                                        Change from preceding month
                                                 June                                      July
                                Previous   Revised   Previous   Revised   Previous   Revised   Previous   Revised
                               (Billions of dollars)      (Percent)      (Billions of dollars)      (Percent)
Personal income:
Current dollars                     5.2       3.3        0.0       0.0       65.6      56.1        0.4       0.3
Disposable personal income:
Current dollars                     3.0       2.1        0.0       0.0       39.6      28.8        0.3       0.2
Chained (2009) dollars             -2.7      -3.4        0.0       0.0       23.9      13.2        0.2       0.1
Personal consumption expenditures:
Current dollars                    31.3      18.8        0.2       0.1       44.7      43.6        0.3       0.3
Chained (2009) dollars             23.0      11.8        0.2       0.1       29.3      27.2        0.2       0.2

BOX.____________________________
                                Hurricane Harvey

The August estimates of personal income and outlays reflect the effects of Hurricane Harvey that made landfall in southeastern Texas on August 25th.
BEA cannot separately quantify the total impact of the storm on personal income
and outlays because most of the source data used to estimate the components of personal income and outlays do not separately identify storm impacts.
BEA made adjustments to estimates where source data were not yet available or
did not fully reflect the effects of the storm.


For more information on the treatment of disasters within the national income and product accounts, see
How are the measures of production and income in the national accounts affected by a natural or man-made disaster?
________________________________


                                Next release:  October 30, 2017 at 8:30 A.M. EDT
                                  Personal Income and Outlays:  September 2017

Additional Information/Resources
Additional Resources available at www.bea.gov:

Stay informed about BEA developments
> by reading the BEA blog,
> by signing up for BEA’s email subscription service, or
> by following BEA on Twitter @BEA_News 

• Historical time series for these estimates can be accessed in BEA’s Interactive Data Application.
• Access BEA data by registering for BEA’s Data Application Programming Interface (API).
• For more on BEA’s statistics, see our monthly online journal, the Survey of Current Business.
• BEA's news release schedule
NIPA Handbook:  Concepts and Methods of the U.S. National Income and Product Accounts
 

BEA Release: State Personal Income: Second Quarter 2017

News Release
EMBARGOED UNTIL RELEASE AT 8:30 A.M. EDT,
Tuesday, September 26, 2017
 
State Personal Income: Second Quarter 2017
For the full release and tables, visit https://www.bea.gov/newsreleases/regional/spi/spi_newsrelease.htm
State personal income grew 0.7 percent on average in the second quarter of 2017, after increasing 1.4 percent in the first quarter, according to estimates released today by the Bureau of Economic Analysis (table 1). Each of the major aggregates of personal income–net earnings, property income, and personal current transfer receipts–grew more slowly than in the first quarter.
Personal income grew 1.3 percent in Nevada, faster than in any other state. Utah had the next fastest growth at 1.1 percent. Iowa, Nebraska, and West Virginia had the slowest growth in personal income, with each state growing less than half the rate of the nation.
Personal Income: Percent Change, 2017:Q1-2017:Q2 
Earnings. On average, earnings increased 0.8 percent in the second quarter of 2017, after increasing 1.5 percent in the first quarter. Earnings growth ranged from 1.6 percent in Nevada to -0.1 percent in Nebraska, and was the leading contributor to growth in personal income in most states (table 2).
Earnings 2017:Q1-2017:Q2 (Percent Change)
  • Growth in construction earnings was the leading contributor to above average earnings growth in Nevada and Oregon (table 3).
  • Growth in retail trade earnings was the leading contributor to above average earnings growth in Utah.
  • Growth in professional, scientific, and technical services earnings was the leading contributor to above average earnings growth in Florida.
  • Growth in information earnings was the leading contributor to above average earnings growth in Georgia and Colorado.
  • Growth in construction earnings and in finance and insurance earnings were both contributors to above average earnings growth in Rhode Island.
  • Growth in finance and insurance earnings was the leading contributor to above average earnings growth in Texas.
Farm earnings declined for the nation and in every state in the second quarter (table 4) and was the leading contributor to slow earnings growth in many states. In Nebraska, Iowa and North Dakota, the decline in farm earnings reduced earnings growth by half a percentage point or more. The slow growth in farm earnings reflects lower prices for grains and other crops.
For the nation, earnings grew in 20 of the 24 industries for which BEA prepares quarterly estimates. Earnings growth in three industries–health care and social assistance; professional, scientific, and technical services; and finance and insurance–was the leading contributor to overall growth in personal income.
Property income. Property income increased 0.8 percent in the second quarter of 2017, down from 1.3 percent in the first quarter. Property income growth ranged from 1.2 percent in Michigan to 0.4 percent in Rhode Island.
Transfer receipts. Transfer receipts grew 0.2 percent for the nation in the second quarter of 2017, down from the 1.3 percent growth in the first quarter. Growth rates ranged from 2.0 percent in Alaska to -1.1 percent in Iowa.

Updates to Personal Income. Today, BEA also released revised annual estimates of state personal income for 2014 to 2016 and revised quarterly estimates for 2014:Q1 to 2017:Q1. Updates were made to incorporate source data that are more complete and more detailed than previously available, to incorporate updated seasonal factors, and to align the states with revised national estimates that were released with the July 2017 annual update to the National Income and Product Accounts.
****
Next release: December 20, 2017, at 8:30 A.M. EST – State Personal Income: Third Quarter 2017.
_______________________________________________________________________

BEA Regional Facts (BEARFACTS), a narrative summary of personal income, per capita personal income, and components of income for each state
 

Most Powerful Corporations in the World?


Published on Oct 1, 2017
Views: 226,895
​The 2,000-kilometer quantum communication line put into use on Friday is the world's first trunk line for secure quantum telecommunications. Known as the Beijing-Shanghai Trunk Line, it connects the country's major secret communication network nodes: Beijing, Jinan, Hefei and Shanghai.

Subscribe to us on YouTube:
https://goo.gl/lP12gA

Download our APP on Apple Store (iOS): https://itunes.apple.com/us/app/cctvn...

Download our APP on Google Play (Android): https://play.google.com/store/apps/de...

Follow us on:

Facebook:
https://www.facebook.com/ChinaGlobalT...
Instagram: https://www.instagram.com/cgtn/?hl=zh-cn
Twitter: https://twitter.com/CGTNOfficial
Pinterest: https://www.pinterest.com/CGTNOfficial/
Tumblr: http://cctvnews.tumblr.com/
Weibo: http://weibo.com/cctvnewsbeijing

China > World's 1st Quantum Communication Line


Published on Oct 1, 2017
Views: 597
​The 2,000-kilometer quantum communication line put into use on Friday is the world's first trunk line for secure quantum telecommunications. Known as the Beijing-Shanghai Trunk Line, it connects the country's major secret communication network nodes: Beijing, Jinan, Hefei and Shanghai.

Subscribe to us on YouTube:
https://goo.gl/lP12gA

Download our APP on Apple Store (iOS): https://itunes.apple.com/us/app/cctvn...

Download our APP on Google Play (Android): https://play.google.com/store/apps/de...

Follow us on:

Facebook:
https://www.facebook.com/ChinaGlobalT...
Instagram: https://www.instagram.com/cgtn/?hl=zh-cn
Twitter: https://twitter.com/CGTNOfficial
Pinterest: https://www.pinterest.com/CGTNOfficial/
Tumblr: http://cctvnews.tumblr.com/
Weibo: http://weibo.com/cctvnewsbeijing

October 2017 General Conference Saturday Session 01 Oct


Streamed live on Sep 30, 2017
All members of the Church are invited to participate in the 187th Semiannual General Conference of the Church.

Subscribe to Mormon Channel for the latest videos:
http://bit.ly/1M0iPwY

Download the Mormon Channel App
iOS:
http://bit.ly/1yGRgRU
Android:
http://bit.ly/1ukxbeC

Follow Mormon Channel
Facebook:
https://www.facebook.com/mormonchannel
Twitter:
https://twitter.com/mormonchannel
Instagram:
https://instagram.com/mormonchannel
Pinterest:
https://www.pinterest.com/mormonchannel

The Church of Jesus Christ of Latter-day Saints

Cartoon Carousel The nation’s cartoonists on the week in politics | By POLITICO STAFF 01/23/2026 05:00 AM EST

Every week political cartoonists throughout the country and across the political spectrum apply their ink-stained skills to capture the fo...