Seeing is believing - and then again we have the ADEQ forecast discussion [scroll down for that]
Phoenix Visibility Web Cameras
Map points are for location identification purposes only.
PhoenixVis.net brings you live pictures and corresponding air quality conditions from scenic urban and rural vistas in the Phoenix, Arizona region.
This page provides an overview of all Phoenix Visibility Web Cameras. In addition, near real-time air quality data provide visibility information to the public.
Digital images from Web-based cameras are updated every 5 minutes. Images will appear black during the nighttime hours for obvious reasons. If the image is missing, please be patient and try again later.
For more air quality information contact us at Arizona Department of Environmental Quality (ADEQ).
Current Views
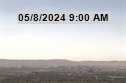
South Mountain
South Mountain is a rugged mountain south of metropolitan Phoenix. The view is from North Mountain looking toward the Phoenix downtown skyline and the South Mountains in the distance.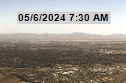
Estrella Mountains
The Sierra Estrellas form a jagged skyline southwest of metropolitan Phoenix. The camera view looks southwest from North Mountain.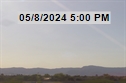
White Tank Mountains
The White Tank Mountains lie to the west of metropolitan Phoenix. The camera view looks west from Avondale.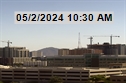
Camelback Mountain
The distinctive profile of this inner city mountain gives it its name. It is bordered by the cities of Phoenix, Scottsdale and Paradise Valley. The view is from the Capital Mall area of downtown Phoenix looking northeast toward Camelback Mountain.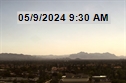
Superstition Mountains
The Superstition Mountains are part of the designated Superstition Wilderness Area. The view is looking east from downtown Mesa with the community of Apache Junction between the camera and the mountain vista.
Air Quality Hourly Forecast | Phoenix
Saturday Forecast:
Air Quality By Pollutant:
5/26/2023
5/27/2023
5/28/2023
5/29/2023
5/30/2023
Forecast Discussion:
Yesterday (Thursday), almost every ozone monitor in the Valley saw ozone in the Moderate Air Quality Index (AQI) category. Highest ozone levels were noted at the Cave Creek monitor, a result of the southerly (from the south) winds pushing ozone northward. However, only one PM10 (dust) monitor saw PM10 in the Moderate AQI category--a monitor located in the industrial areas southwest of Phoenix.Looking ahead, the weather pattern over the Southwest will be active today and through this Memorial Day weekend. A pair of low pressure waves will move through, helping to keep high temperatures at or slightly below normal (which is 98 degrees F). These waves will also continue to provide winds to our region. And since these waves are dry, skies will remain sunny.
Air quality-wise, the sunny skies will allow ozone to form, but the winds will help to disperse the ozone. Therefore, ozone is forecast in the Moderate AQI category through the period. The main day to watch will be Saturday though, when winds will be their lightest; ozone is forecast to be highest on this day.
Regarding PM10, PM10 will continue to be highest in the industrial areas south/southwest of Phoenix. This is because of morning local activity typical on weekdays. The main outlier should be Monday morning, which may see less morning activity because of the holiday. Otherwise, pockets of dust may be possible in dust-prone areas on the breezier afternoons.
Lastly, PM2.5 (smoke) is forecast in the Good AQI category each day and should generally follow PM10 trends.
Have a great Memorial Day weekend! Check back on Tuesday morning for the next forecast.
- M. Graves
ADEQ Meteorologist


