Please note this post is not just another data dump - it really needs to get drilled-down into our numb thick skulls.
The Economic Policy Institute published a new study and report three days ago naming this time in the 21st Century "The New Gilded Age" harking back to the name humorist Mark Twain gave to the decades-long epoch of robber-baron excesses and accumulations of vast wealth just before the turn of the last century.
A Stunning Glance at the Geography of U.S. Income Inequality
_______________________________________________________________
No idea what The Gilded Age was?
_______________________________________________________________
How does Arizona compare with the rest of the country?
The top 1% make 22.4 times more than the bottom 99%.
Average income of the top 1%: $1,038,410. Average income of the bottom 99%: $46,391.
Counties
_______________________________________________________________
Researchers at the Economic Policy Institute, a Washington, D.C.-based progressive think tank, have understood this reality for decades now. They’ve supplemented their nationally focused work with a series of landmark collaborations that explore how our unequal economic order is playing out at the subnational level.
The New Gilded Age drills down from this merely affluent 5 percent to the simply rich of the top 1 percent.The Economic Policy Institute published a new study and report three days ago naming this time in the 21st Century "The New Gilded Age" harking back to the name humorist Mark Twain gave to the decades-long epoch of robber-baron excesses and accumulations of vast wealth just before the turn of the last century.
A Stunning Glance at the Geography of U.S. Income Inequality
New Economic Policy Institute research exposes just how top-heavy many of the places Americans call home have become.
Blogging Our Great Divide July 19, 2018
Source >> https://inequality.org
All politics, the old political saw goes, is local. By the same token, all economics may be local, too. We don’t experience our economy as a national or a global phenomenon. We experience our economic life in much more localized spheres. _______________________________________________________________
No idea what The Gilded Age was?
How does Arizona compare with the rest of the country?
Arizona ranks #18 of the 50 states in income inequality, based on the ratio of top 1% to bottom 99% income.
Inside Arizona Metropolitan areas
The Phoenix-Mesa-Scottsdale metro area is the most unequal metro area in Arizona.
Maricopa County is the most unequal county in Arizona.
- The top 1% make 22.8 times more than the bottom 99%.
- Average income of the top 1%: $1,086,476.
- Average income of the bottom 99%: $47,600.
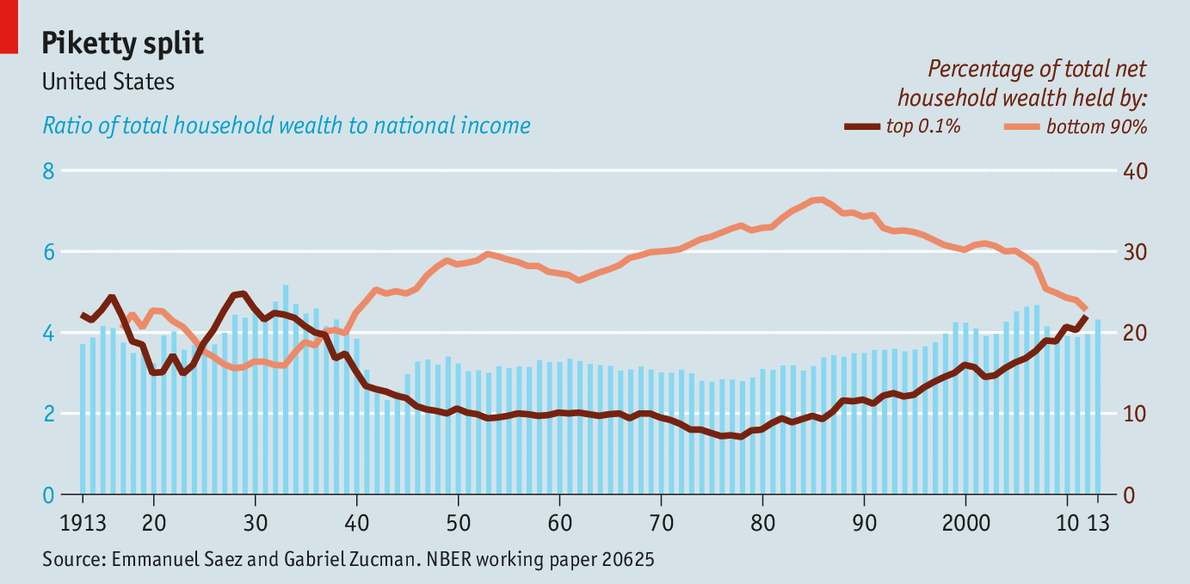
Share of income captured by the top 1%, 1917–2015
The Unequal States of America
Income inequality in the United States
Income trends have varied from state to state, and within states. But a pattern is apparent: the growth of top 1% incomes. Explore inequality in this interactive feature >>
The share of all income held by the top 1% in recent years has approached or surpassed historical highs. Collaboration in this series — EPI’s most comprehensive installment yet — has just appeared. This new study, The New Gilded Age: Income Inequality in the U.S. by State, Metropolitan Area, and County, essentially combines two schools of progressive economic thought, the work of American economists who’ve been involved with EPI over the years and the work of international scholars connected with the influential French economist Thomas Piketty. . .


The New Gilded Age finds — no surprise — that income inequality in the United States “has risen in every state since the 1970s.” The surprise comes from the numbers that cover 2015, the most recent year with full stats available. Despite all the focus we’ve seen of late on income inequality, the gap between our most financially fortunate few and everybody else is growing even wider . . ."
What we want, the new EPI research helps us feel rather intensely, ought to be cities, counties, and states with far, far smaller gaps between those of mega means and everyone else. . . "
Sam Pizzigati co-edits Inequality.org.
RELATED CONTENT: A Sweet New Century for America’s Most Privileged
Link >> https://inequality.org/great-divide/a-sweet-new-century-for-americas-most-privileged/
His latest book, The Case for a Maximum Wage, has just been published.
Among his other books on maldistributed income and wealth: The Rich Don’t Always Win: The Forgotten Triumph over Plutocracy that Created the American Middle Class, 1900-1970. Follow him at @Too_Much_Online.
_________________________________________________________________________
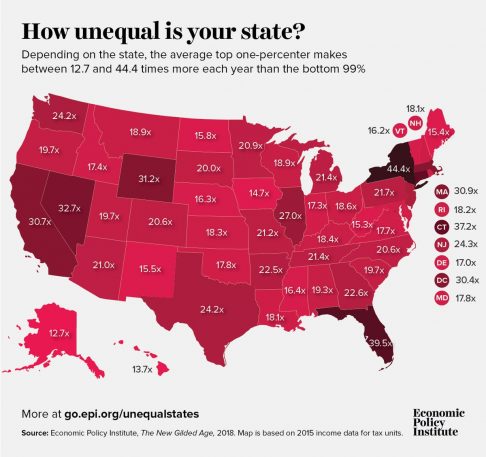
To see how your state fares, check out the map below
Source: https://www.fastcompany.com/90205689/this-map-shows-how-bad-income-inequality-is-in-your-state.

_________________________________________________________________________


