Climate Central communicates climate change science, effects, and solutions to the public and decision-makers.
Climate Central is a nonprofit news organization that analyzes and reports on climate science.
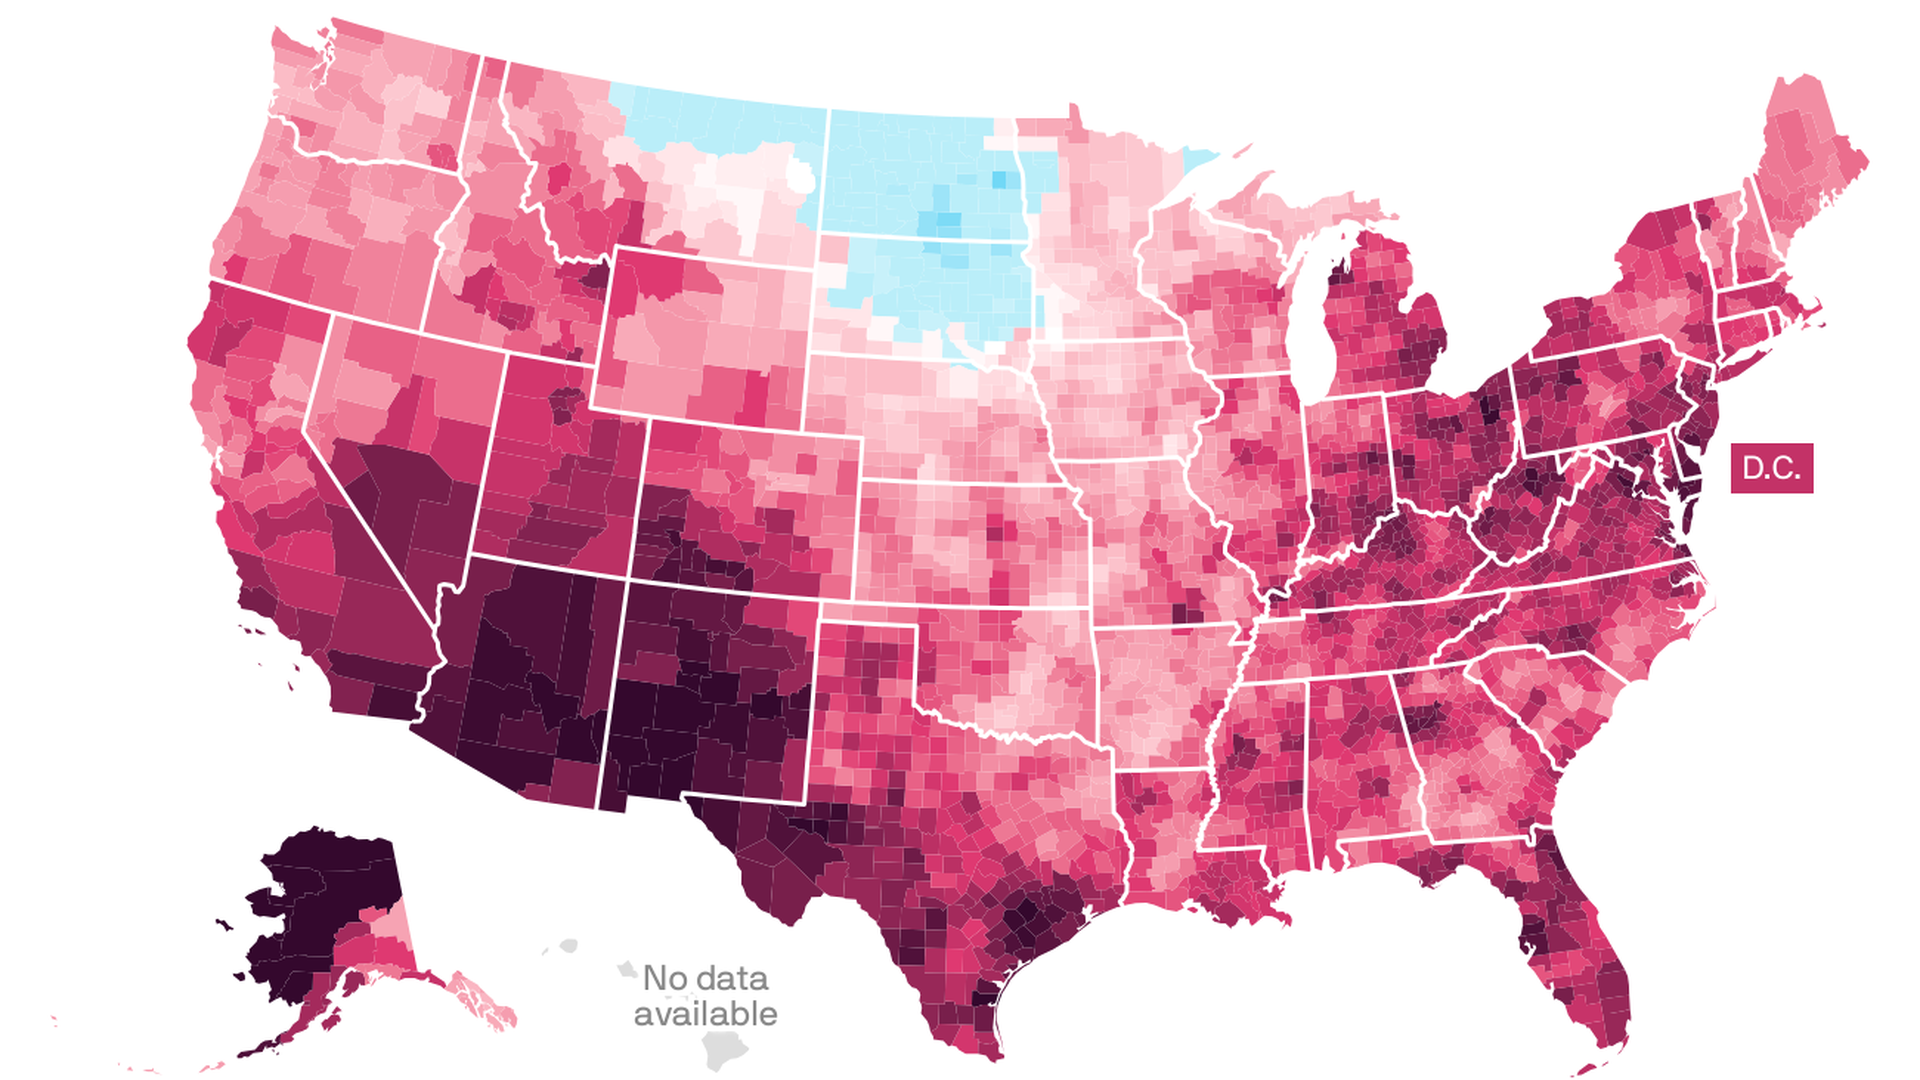
Data: U.S. Spring Temperature Trends

Average temperatures and
days above normal were calculated for each spring (March, April, May)
from 1970 to 2024 using data obtained from the Applied Climate Information System.
Spring days above normal are defined as the number of days where the
average temperature was above the 1991-2020 NOAA/NCEI climate normal.
Climate Central's local analyses include 247 stations.
- For reported data summaries based on linear regression, however, only 241 stations are included due to data completeness measures that were not met by six stations: Bend, Ore.; Hazard, Ky.; Jefferson City, Mo.; Jonesboro, Ark.; Twin Falls, Idaho; and Wheeling, W.Va.
This Climate Matters analysis was made possible by open access data from NOAA/NCEI.
Please click here to download local temperature trend data for 240+ U.S. locations.
This dataset supports U.S., state-, and county-level charts downloadable from this page.
Embeddable interactive maps and custom data views are available here through Observable
For background on these trends, their connections to climate change, and their local impacts, click here for the most recent spring package from Climate Matters.


No comments:
Post a Comment