Yesterday,
Donald Trump nominated candidate Kevin Walsh to become Chair of the
Federal Reserve.
- Warsh is mostly an orthodox Wall Street GOP pick,
though he is married to the billionaire heiress of the Estee Lauder
fortune and was named
in the Epstein files.
- He’s perceived not as a Trump loyalist but as an
avatar of capital; here’s Obama advisor and Democratic economist Jason
Furman making the case for Warsh.
Kevin Warsh is well above the bar on both substance and independence to be Chair of the Federal Reserve.
The Senate should ask tough questions about his independence & President Trump should reduce the threat to it.
Hopefully that will make it clear Warsh should be confirmed.
4:09 AM · Jan 30, 2026 · 65.2K Views
27 Replies · 30 Reposts · 211 Likes
There’s
a lot to say about the politics of the Fed, but a contact of mine in
Trump-world told me the way these guys understand political success or
failure is pretty simple. Are the wages of middle class Americans
increasing? That’s it.
In other words, Warsh’s job is to make
sure the public likes Trump’s economy. And that’s tough. In Trump’s
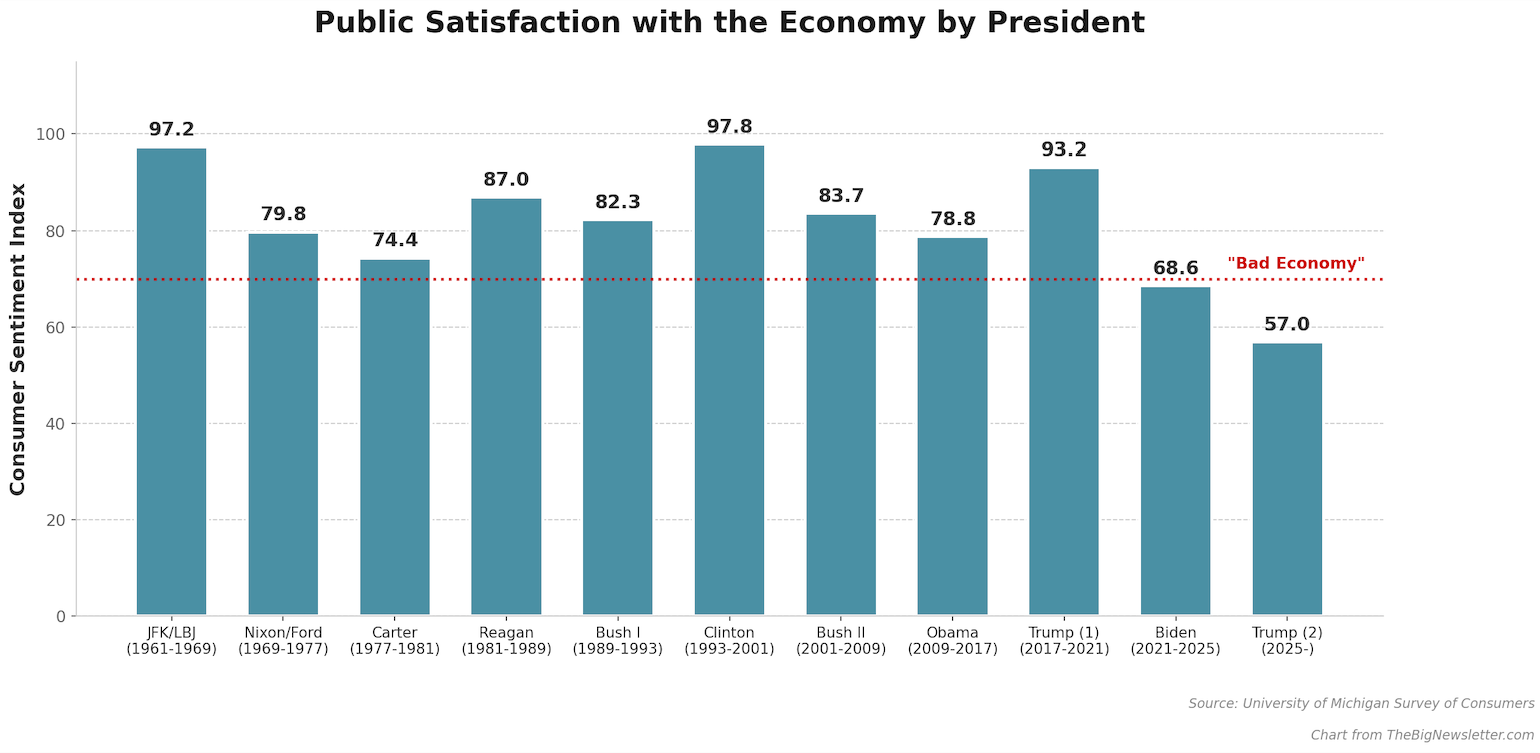
first term, people were happy with the economy, this time they are not.
In fact, if you judge solely by consumer sentiment, Trump’s first term
was the third best economy Americans experienced since 1960. Trump’s
second term is not only worse than his first, it is the worst economic
management ever recorded by this indicator.
Seen
in this light, it makes sense that there were the beginnings of a
political realignment under Trump. Americans were genuinely getting rich
in ways they hadn’t experienced in decades, and they did experience a
horror show under Joe Biden. It also explains why Trump is so unpopular
today, with Americans complaining about the economy in a way they didn’t
in his first term.
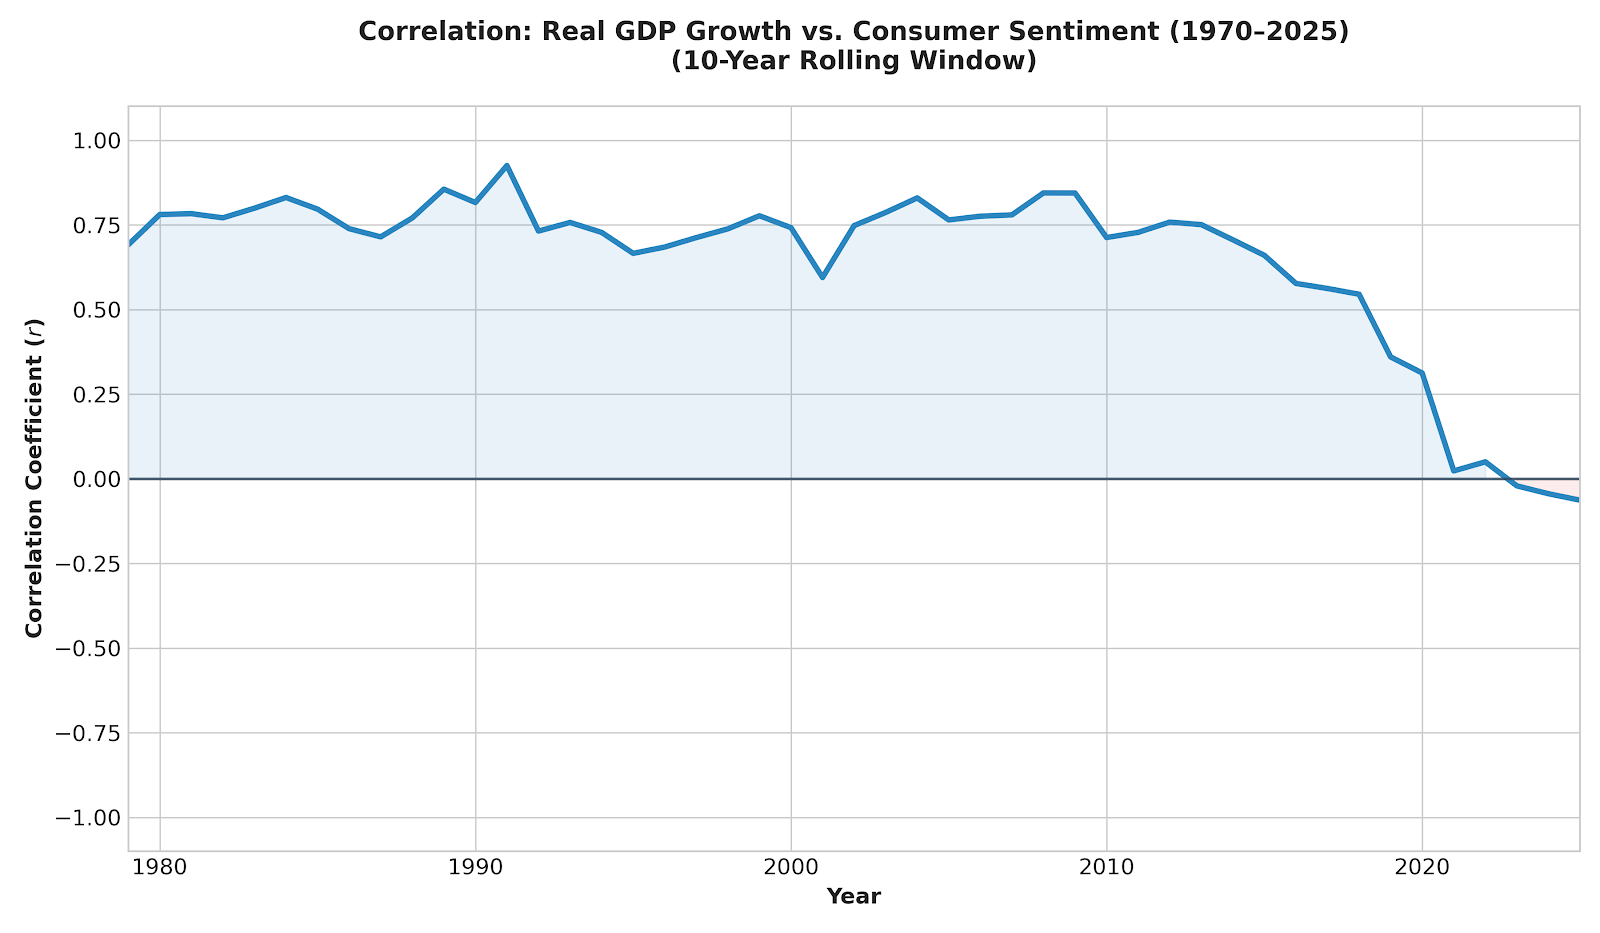
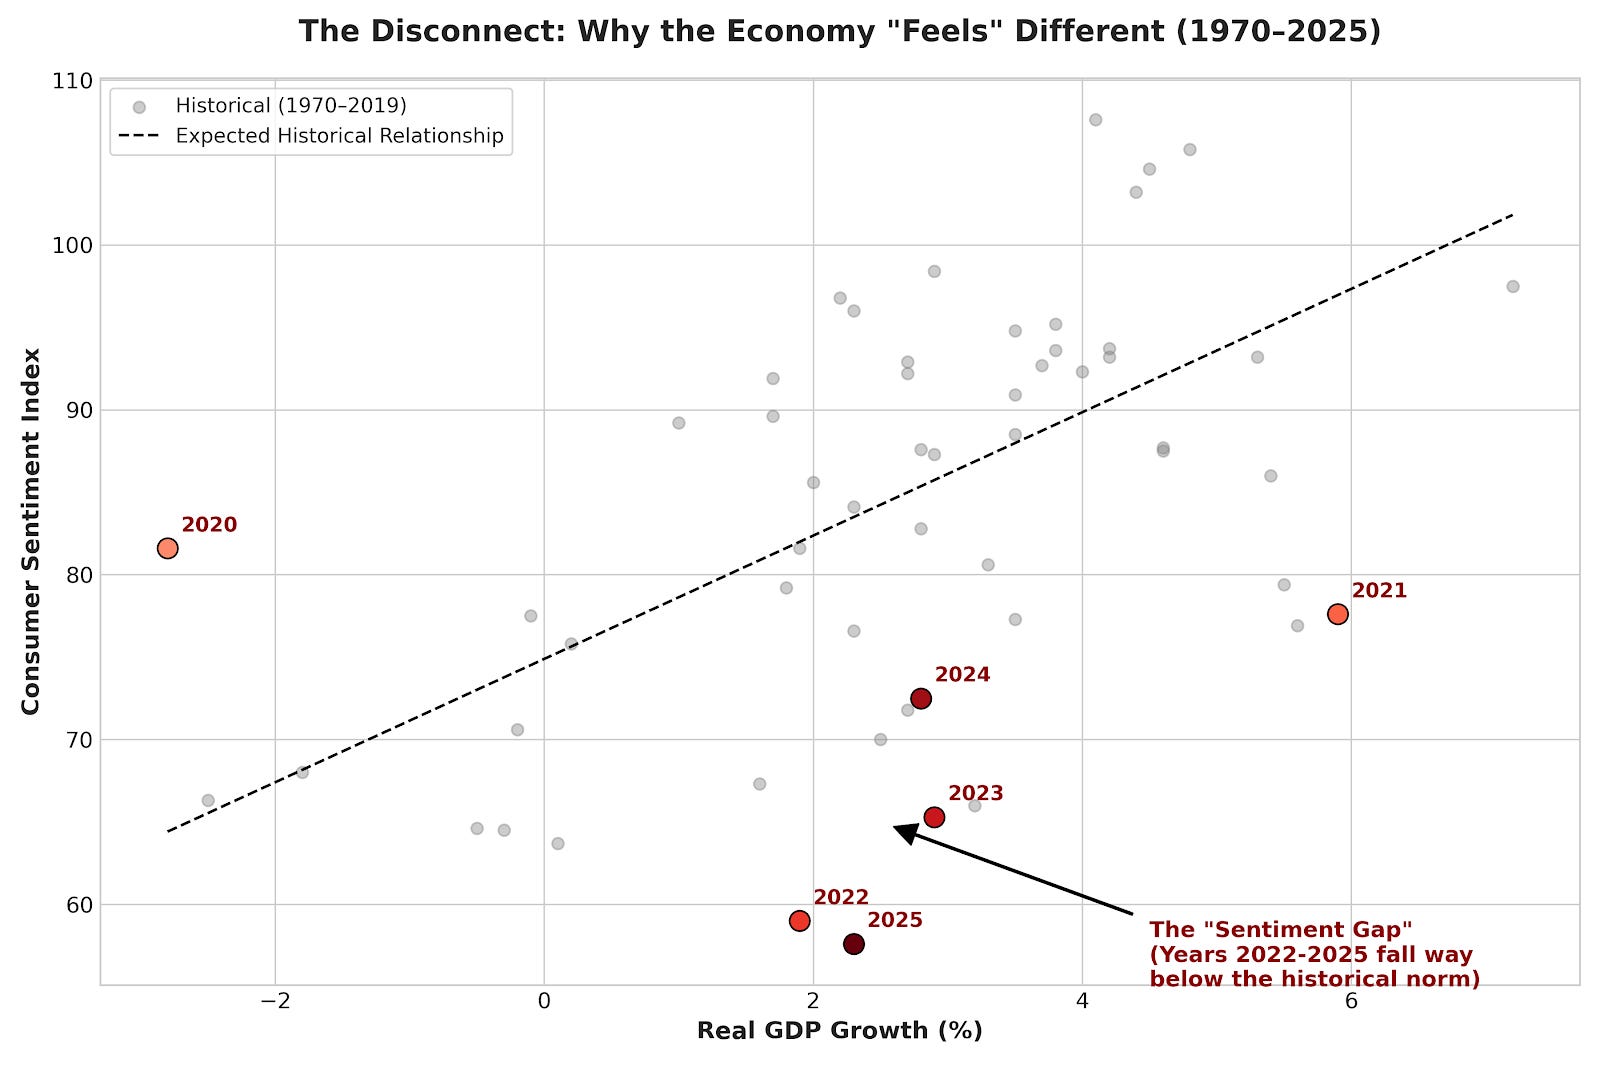
This observation isn’t a commentary about
Biden or Trump, but about a structural change in the economy. You can
see how people think about economic growth itself has shifted. Here’s
the relationship between growth and consumer sentiment. They used to
rise in parallel, higher growth meant more consumer confidence, but they
started breaking down in the mid-2010s, and fell apart completely
post-Covid.
If
you look not at whether sentiment is correlated with growth, but at
absolute levels, the situation is even more clear. Growth has been
pretty good from 2021-2025, but the public is really mad.
What’s
odd is that wages are increasing today about the same as they were in
Trump’s first term. In 2018, when the University of Michigan consumer
sentiment indicator was at a buoyant 98.4, real average hourly wages were up annually by 1.1%. In 2025, when the sentiment indicator was at 57.6, the lowest ever recorded, real average hourly wages increased annually by… 1.1%.
I
think Warsh has a rough task, because the models underpinning how
policymakers think about the economy just don’t reflect the realities of
modern commerce. The fundamental dynamic is that those models were
constructed in an era where America was one discrete economy, with Wall
Street and the public tied together by the housing finance system.
But today, Americans increasingly live in tiered bubbles that have less
and less to do with one another. Warsh will essentially be looking at
the wrong indicators, pushing buttons that are mislabeled.
While
corporate America is experiencing good times, much of the country is
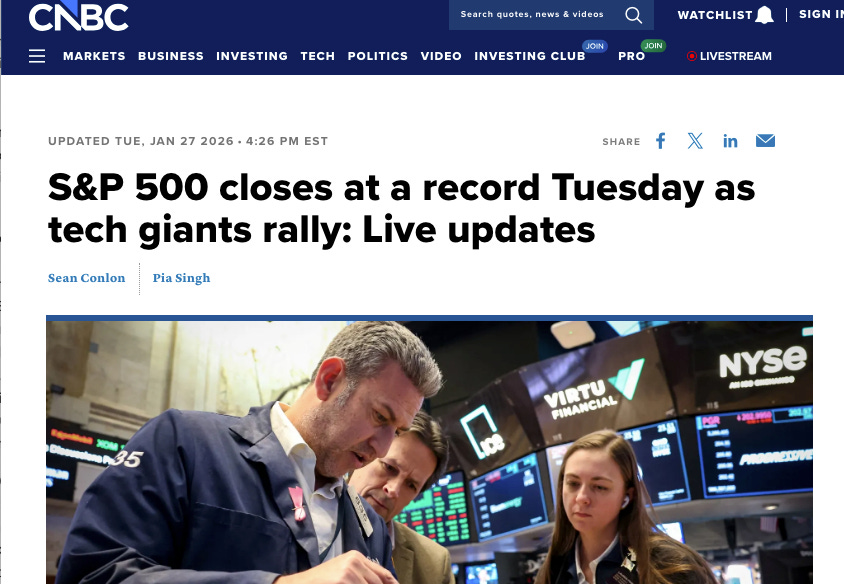
experiencing recessionary conditions. Let’s contrast consumer sentiment
indicators with statistics showing an economic boom. Last week, the
government came out with stats on real gross domestic product increasing
at a scorching 4.4% in the third quarter of last year. There’s higher
consumer spending, corporate investment, government spending, and a
better trade balance. Inflation, according to the Consumer Price Index,
is low at 2.6.% over the past year. And while official numbers aren’t
out for the final three months of the year, the Atlanta Fed’s GDPNow
forecast shows that it estimates
growth at 4.2%. And there are other indicators showing prosperity, from
low unemployment to high business formation, which was up about 8% last
year, as well as record corporate profits.
These
numbers would seem to cut against what I observed about how angry the
public is on the economy. On CNBC, analysts discount consumer sentiment
indicators. They are just a poll of what people think, not “hard” data
of pricing or profits. The consumer powers ahead, even if consumers are
unhappy.
Behavioral economists and psychologists
have all sorts of reasons to explain that people don’t really understand
the economy particularly well. But in general, when the stats and the
public mood conflict, I believe the public is usually correct. Often,
there are some weird anomalies with the data used by policymakers. In
2023, I noticed
that the consumer price index, the typical measure of inflation, didn’t
account for borrowing costs, so the Fed hike cycle, which caused
increases in credit card, mortgage, auto loan, payday loans, et al, just
wasn’t incorporated. The public wasn’t mad at phantom inflation, they
were mad at real inflation that the “experts” didn’t see.
I
don’t think that’s the only miscalculation. Let’s go back to the 2018
vs 2025 comparison, and look at a specific item in consumer spending, to
see a good illustration of this phenomenon. “Consumer spending” is
considered good, aka it’s stuff people want. It has many components,
because people buy lots of different things, from food to clothing to
health care.
There’s an item in the personal consumer expenditure data called Financial services furnished without payment (107), on which
Americans are going to spend roughly $600 billion this year, or $2k per
person. That’s not a small amount, and it’s also growing very quickly.
So what is this item? Basically, it’s “free” checking. When you keep
your savings in a bank, and that bank pays you much less than the market
rate of interest, that’s a cost you don’t necessarily see, but a cost
nonetheless. The Bureau of Labor Statistics (BLS) assumes
the $2k a year you send banks by receiving too little on your deposits
is tallied as “buying” free check and banking apps. That’s considered
more consumer spending, and more consumer spending means a happier
consumer. Aka, BLS thinks you really like your banking app.
I’ve
done a bit of analysis of this category to see how it changed from 2018
to 2025. Banking services were overpriced at the beginning of Trump’s
first term, but stayed pretty stable. For the entire Trump
administration, this category of “consumer spending” increased by
$10/month, from roughly $1000/year to $1120/year. Still overpaying for
banking, but the increase wasn’t hugely noticeable over four years. For
2018, it was an increase of $2.50/month. The Fed had its interest rates
at near zero, so banks couldn’t underpay that much. In 2019, the amount
consumers “paid” banks even dropped, which is a price cut.
What
happened next? Under Biden, as interest rates jumped and banks took
advantage by raising prices to consumers, Americans paid an additional
annual amount of $230 billion a year, roughly more than $700 per person.
That’s a big increase. And how about 2025? Well, we don’t have the full
year’s worth of data, but just taking the first three quarters it’s
about the same increase as it was for the entire four years of the Trump
administration.
This category matters for three reasons.
First,
it’s “consumer spending,” meaning that it’s considered something people
choose to spend their income on. When commentators talk about the
“strength of the consumer” or consumers “continuing to spend,” this
category is included in their formulation. That’s crazy. But no one wants
a banking app or checks, it’s non—discretionary, akin to taxes. No one
says “consumers choose to continue paying taxes,” because it’s not a
choice. Neither, really is this one, though there is more flexibility
because you can select among banks.
Economists distinguish
between income and disposable income, which is what you earn after
taxes. But increasingly, things that feel like taxes are eating up more
and more of what people earn. For instance, according to the Personal
Consumption Expenditures index, a large chunk of the increase in
consumer spending in 2025 was health care, housing and utilities, and
financial services. These are “non-discretionary,” meaning people have
to pay them. But they show up as a bigger economy and more consumer
spending.
Gross domestic product, after all, is just a sum of the
financial value of all products and services produced inside the U.S.
Are people psyched to pay more in rent and medicine and electricity
costs? Are they getting better housing and health care and electricity? I
doubt it. When Pfizer raises prices for a drug and sells the same
amount, consumer spending goes up. Does this price hike reflect a
happier consumer just because consumer spending went up? I don’t think
so.
And it’s not just the big obvious stuff. Like imputed
banking fees, a lot of this new fake spending and growth is not obvious.
I coined a term for these, economic termites, which companies that find ways of exploiting market power in unnoticeable ways, like monopolizing hospital quality surveys. They ‘contribute’ to consumer spending and GDP, but create no actual value.
And
that brings me to the second reason the example of banks overcharging
consumers matters. Who is more likely to be paying this cost? Rich
people tend to get better deposit rates, so the answer is people with
lower deposit amounts. That’s inequality, right there, and not income
inequality, but spending inequality. There’s pervasive price discrimination against normal people, and this category is a good example.
But there are many others.
For instance, last November, the Atlanta Fed came out with a paper
showing that from “2006 to 2020, poorer metropolitan statistical areas
experienced annualized food inflation that was 0.46 percentage points
higher than that of richer ones—amounting to a cumulative difference of
8.8 percentage points over the period.” The reason was consolidation,
but the point here is there’s a different kind of inequality you can’t
get from just consumer spending metrics. As another example, if you are
middle class, and you are paying for a high deductible health care plan
you are trying to avoid using, you are getting less than a wealthier
person who has more comprehensive coverage.
Our models of
inequality are based on looking at one side of the ledger, wealth and
income. If you have a lot of money and/or a high income, you are rich,
if you don’t, you aren’t. Analysts are fumbling at this situation by
observing there is stark income inequality, the so-called “K Shaped
Economy,” often accompanied by this chart.
But
while income inequality matters, I’m not totally sure it captures what
is happening. More inequality would cause people to feel that the world
is unfair, but in a world with higher real income growth, it wouldn’t
cause working people to be unable to afford what they could buy the year
before. Yet they constantly report feeling pinched.
This mystery becomes less mysterious when you consider spending, aka the other side of the ledger. What if your dollar doesn’t go as far if you’re poor?
Imagine
if there were a different currency for Americans based on class. Let’s
say there were poor people dollars, which are worth 80 cents apiece,
normal people dollars, which are worth 95 cents apiece, and rich people
dollars, which are worth 105 cents apiece. If that were the case, how
would someone in a policy role understand the welfare of the public?
When
calculating consumer spending or inflation, they’d have to find a way
to see that the spending of someone who is poor just doesn’t go as far
as someone who is rich. To get an accurate account of how Americans are
doing, basic national welfare, they would look at these three classes as
if they each lived in different countries with different GDPs. And they
could adjust based on differing currency valuations.
Doing such
an analysis would solve the mystery of why working people feel pinched
despite getting higher incomes. What looks like an increase in real
wages in aggregate might not be an increase for some, because poor
people dollars don’t go as far as rich people dollars. Such a situation
isn’t something we’ve really considered, because we’ve just never had a
society based on pervasive price differences among different classes. We
certainly didn’t have one in 1934 when economists created the model for
quantifying economic growth.
That said, treating subgroups
as living in different economies is not as outlandish as you might
think. There are multiple consumer price indexes, including an experimental one
that tracks how prices change for the elderly. In a K-Shaped economy,
we need different measurements beyond aggregate statistics for consumer
spending and growth, or just looking at different wealth and income
amounts. We need to know about spending inequality as well.
The
final interesting aspect of comparing deposits paid to consumers in
2018 vs 2025 is that it shows market power can matter when thinking
about inflation and real wages. A few days ago, Fed Chair Jay Powell
discussed tariffs, and whether supply side or demand side channels were
driving price increases. Of course, tariffs are something that are
verboten on Wall Street, so it’s ok to believe they negatively affect
prices. By contrast, everyone who matters has agreed we should ignore
whether monopolies contribute to prices, even though plenty of economic
models treat tariffs and monopolies similarly.
But that ignorance
needs to end. The reason banks don’t raise interest rates on deposits
when the Fed increases rates is because they don’t have to, as there
isn’t enough competition to force them to compete with each other over
deposits. It’s a pain in the ass to change banks, intentionally so,
which is why banks lobbied against an open banking rule to make it
easier. Additionally, when banks advertising free checking or don’t
charge a fee for online banking, they aren’t disclosing the additional
large cost of low rates on deposits. Macro-economists scoff at market
power as a driver of inflation, except when it comes to working people
getting raises or immigration. But here we go.
In other words,
while wage increases were the same in 2018 and 2025, and consumer
spending went up both years, what people bought was not the same. In
Trump’s first term, broadly speaking, higher incomes went to consumer
spending for stuff people wanted. In his second term, broadly speaking,
higher income is going to consumer spending for stuff people don’t want
but have to buy, especially for poor and working people. And these are a
result, in part, of elevated market power unleashed by the post-Covid
moment and the Fed hiking cycles, as well as changing dynamics of health
care costs.
Finally,
there’s a more philosophical point, which I don’t think explains the
short-term frustrations people feel, but is directionally correct. Do
people actually want what the economy is
producing? For most of the 20th century, the answer was yes. When Simon
Kuznets invented these measurement statistics in 1934, financial value
and the value that Americans placed on products and services were
similar. A bigger economy meant things like toilets and electricity
spreading across rural America, and cars and food and washing machines.
Today? Well, that’s less clear. According to the Bureau of Labor Statistics,
the second fastest growing sector of the economy in terms of GDP growth
from 2019-2024 was gambling. Philip Pilkington wrote a good essay
last summer on the moral assumptions behind our growth statistics.
There is no agreed upon notion of what makes up an economically valuable
object or activity, so our stats are inherently subtle moral judgments.
Classic moral philosophers like Adam Smith believed in the “use value”
of an item, meaning how it could be used, whereas neoclassical
economists believed in the “exchange value” of an item, making no
judgments about use and are just counting up its market price.
Normal
people subscribe on a moral level to use value. Most of us see someone
spending money on a gambling addiction as doing something worse than
providing Christmas presents for kids, but not because of price.
However, our GDP models use the market value basis. Kuznets, presumably,
was not amoral, he just thought that our laws would ban immoral
activities like gambling, and so use value and market value wouldn’t
diverge. But they have.
It’s not just things like gambling
or pornography or speculation. A lot of previously unmeasured activity
has been turned into data and monetized, which isn’t actually increasing
real growth but measuring what already existed. Take the change from
meeting someone at a party to using a dating app. One is part of GDP,
the other isn’t. Both are real, but only one would show a bigger
economy.
Beyond that much of our economy is now
based on intangibles - the fastest growing sector was software
publishing. Is Microsoft moving to a subscription fee model for Office
truly some sort of groundbreaking new product? It’s hard to say, while
corporate assets used to be hard things like factories, today much of it
is intangibles like intellectual property.
A
boomcession, where the rich and corporate America experience a boom
while working people feel a recession, is a very unhealthy dynamic. It’s
certainly possible to create metrics to measure it, and to help
policymakers understand real income growth among different subgroups.
You could start looking at real income after non-discretionary consumer
spending, or find ways of adjusting for price discrimination.
But
I think a better approach is to try to knit us into one society again.
The kinds of policymakers who could try to create metrics to understand
the different experiences of classes, and ameliorate them, don’t have
power. Instead, the people in charge still use models which presume one
economy and one relatively uniform set of prices, where “consumer
spending” means stuff consumers want.
I once noted a speech
in 2016 by then-Fed Chair Janet Yellen in which she expressed surprise
that powerful rich firms and small weak ones had different borrowing
rates, which affected the “monetary transmission channel” the Fed relied
on. Sure it was obvious in the real world, but she preferred theory.
Or
they don’t use models at all; Kevin Warsh is not an economist, he’s a
lawyer and political operative, and is uninterested in academic theory.
He cares about corporate profits and capital formation. That probably
won’t work out well either.
At any rate, we have to start
measuring what matters again. If we don’t, then we’ll continue to be
baffled that normal people hate the economy that looks fine on our
charts.
Thanks for reading! Your tips make
this newsletter what it is, so please send me tips on weird monopolies,
stories I’ve missed, or other thoughts. And if you liked this issue of
BIG, you can sign up here for more issues, a newsletter on how to restore fair commerce, innovation, and democracy.
Consider becoming a paying subscriber to support this work, or if you are a paying subscriber, giving a gift subscription to a friend, colleague, or family member.
If you really liked it, read my book, Goliath: The 100-Year War Between Monopoly Power and Democracy.

cheers,
Matt Stoller
Key Themes and Reception
- Historical Context:
The book aims to recover a "secret history" of American anti-monopoly
activism that has been largely forgotten, emphasizing that
monopolization is the result of political choices, not inevitable market
forces.
- Author's Argument:
According to Stoller, understanding this history is crucial for
addressing current threats to democracy, and that collective action
through government intervention is necessary to restore competitive
markets and democratic governance.
- Critical Reception: The book has been called "a meticulously researched, powerfully argued and beautifully written book" by The Washington Book Review and an "insightful" look by The New York Times. It has been praised as a necessary historical correction to modern economic and political narratives.