02 November 2021

Image updated every 5 minutes. . .Superstition Mountains from Downtown Mesa

Forecast discussion: Image updated every 5 minutes.

????????????????????????????????????????????????????????

Superstition Mountains
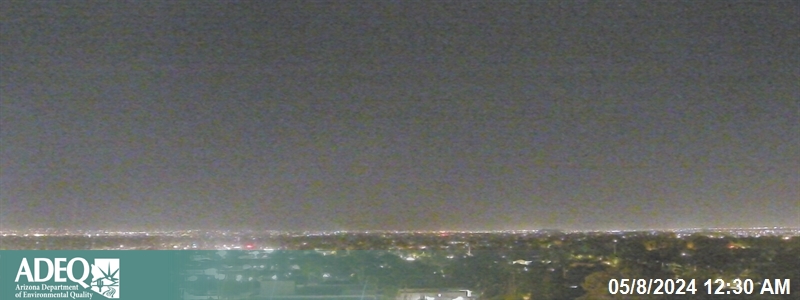
Webcam Image
  • Zoom In Zoom In
  • Refresh Refresh
  • Larger Image View Larger
  • Landmarks Landmarks
  • Map It Map It
Clock Image Archive                                        

Image updated every 5 minutes.

=============================

Air quality-wise, mild weather conditions this time of year typically means locally-driven pollution. Cooler morning temperatures and light winds are favorable for the buildup of PM10 (dust) and PM2.5 (smoke) from local activity. However, warmer afternoon temperatures will help to mix out PM10 and PM2.5 from the mornings.

EXCEEDANCE REPORT

AQ Exceedance

This report displays the number of days a monitor exceeded the federal health standard for the given year. Click the monitor to view the dates of each exceedance and the associated concentration.

Previous Day

  2021  


Maricopa County
Monitor
Ozone
PM10
PM2.5
Date
ppb
5/5/2021
72
5/6/2021
76
7/8/2021
71
7/19/2021
71
7/22/2021
75
7/28/2021
71
Date
µg/m3
-
Date
µg/m3
-
Date
ppb
6/11/2021
71
6/29/2021
71
7/30/2021
72
8/3/2021
78
8/4/2021
73
Date
µg/m3
7/12/2021
163
10/11/2021
259
Date
µg/m3
-
Date
ppb
5/13/2021
71
6/11/2021
85
6/15/2021
91
7/21/2021
73
7/22/2021
74
7/28/2021
71
8/4/2021
74
Date
µg/m3
-
Date
µg/m3
-
Date
ppb
6/11/2021
74
6/12/2021
73
6/15/2021
91
6/29/2021
80
7/1/2021
82
7/17/2021
75
7/19/2021
73
7/22/2021
71
7/28/2021
81
7/31/2021
71
8/2/2021
79
8/3/2021
84
8/4/2021
78
8/5/2021
74
8/25/2021
73
8/27/2021
75
8/28/2021
71
9/3/2021
75
9/4/2021
78
9/5/2021
71
Date
µg/m3
10/12/2021
170
Date
µg/m3
-
Date
ppb
-
Date
µg/m3
10/12/2021
163
Date
µg/m3
1/1/2021
53.5
Date
ppb
6/11/2021
77
6/12/2021
71
6/15/2021
93
6/28/2021
75
7/21/2021
78
7/28/2021
72
7/30/2021
73
8/2/2021
73
8/3/2021
76
8/4/2021
82
8/26/2021
73
8/27/2021
74
Date
µg/m3
7/10/2021
170
10/11/2021
155
Date
µg/m3
-
Date
ppb
5/6/2021
75
5/24/2021
76
6/11/2021
78
6/12/2021
80
6/15/2021
89
6/16/2021
76
6/24/2021
72
6/26/2021
73
6/29/2021
72
7/1/2021
78
7/4/2021
72
7/8/2021
77
7/9/2021
71
7/13/2021
71
7/17/2021
77
7/19/2021
78
7/20/2021
71
7/22/2021
82
7/27/2021
73
7/28/2021
87
7/31/2021
80
8/1/2021
73
8/2/2021
73
8/3/2021
76
8/4/2021
77
8/5/2021
77
8/6/2021
73
8/26/2021
76
9/3/2021
74
9/4/2021
77
9/5/2021
72
Date
µg/m3
-
Date
µg/m3
-
Date
ppb
-
Date
µg/m3
10/12/2021
207
Date
µg/m3
-
Date
ppb
5/24/2021
74
6/11/2021
82
6/15/2021
98
6/16/2021
74
7/1/2021
73
7/8/2021
73
7/19/2021
73
7/21/2021
72
7/22/2021
78
7/28/2021
76
8/5/2021
73
Date
µg/m3
-
Date
µg/m3
-
Date
ppb
5/24/2021
72
6/11/2021
79
6/12/2021
75
6/15/2021
97
6/28/2021
72
6/29/2021
72
7/1/2021
71
7/19/2021
74
7/21/2021
76
7/28/2021
75
7/30/2021
73
8/2/2021
73
8/3/2021
73
8/4/2021
80
8/26/2021
74
8/27/2021
75
8/29/2021
75
9/4/2021
79
Date
µg/m3
7/10/2021
173
Date
µg/m3
1/1/2021
51.2
Date
ppb
-
Date
µg/m3
3/3/2021
208
10/12/2021
219
Date
µg/m3
-
Date
ppb
6/11/2021
74
Date
µg/m3
-
Date
µg/m3
-
Date
ppb
5/6/2021
73
5/24/2021
73
6/11/2021
76
6/12/2021
74
6/15/2021
88
6/16/2021
73
7/1/2021
75
7/8/2021
76
7/17/2021
74
7/19/2021
76
7/22/2021
80
7/27/2021
71
7/28/2021
84
7/31/2021
74
8/2/2021
73
8/3/2021
75
8/4/2021
76
8/5/2021
71
8/26/2021
74
Date
µg/m3
-
Date
µg/m3
-
Date
ppb
5/5/2021
72
5/6/2021
71
5/12/2021
71
5/24/2021
75
6/11/2021
72
6/12/2021
81
6/15/2021
85
6/26/2021
72
6/29/2021
76
7/1/2021
83
7/2/2021
72
7/4/2021
73
7/14/2021
71
7/17/2021
80
7/19/2021
73
7/20/2021
71
7/22/2021
76
7/27/2021
73
7/28/2021
83
7/31/2021
80
8/2/2021
77
8/3/2021
83
8/4/2021
77
8/5/2021
75
8/6/2021
72
8/24/2021
74
8/26/2021
71
8/27/2021
76
8/28/2021
82
9/3/2021
79
9/4/2021
80
9/5/2021
76
Date
µg/m3
7/9/2021
199
10/12/2021
170
Date
µg/m3
1/1/2021
72.3
Date
ppb
5/12/2021
72
5/24/2021
76
5/27/2021
72
5/28/2021
71
6/9/2021
71
6/11/2021
82
6/12/2021
76
6/15/2021
108
6/16/2021
72
6/29/2021
73
7/1/2021
78
7/8/2021
75
7/13/2021
73
7/17/2021
71
7/19/2021
77
7/20/2021
80
7/21/2021
74
7/22/2021
74
7/27/2021
79
7/28/2021
85
7/31/2021
71
8/2/2021
75
8/3/2021
75
8/4/2021
81
8/5/2021
73
8/25/2021
81
8/26/2021
72
8/27/2021
73
8/28/2021
76
9/4/2021
81
9/5/2021
77
Date
µg/m3
-
Date
µg/m3
1/1/2021
61.2
Date
ppb
5/6/2021
73
5/24/2021
73
6/11/2021
77
6/12/2021
74
6/15/2021
90
6/16/2021
72
7/1/2021
77
7/8/2021
77
7/17/2021
73
7/19/2021
76
7/20/2021
73
7/22/2021
78
7/27/2021
72
7/28/2021
83
7/31/2021
72
8/2/2021
72
8/3/2021
73
8/4/2021
75
8/5/2021
74
8/26/2021
73
9/3/2021
71
9/4/2021
74
Date
µg/m3
10/12/2021
174
Date
µg/m3
-
Date
ppb
5/12/2021
72
5/24/2021
79
5/28/2021
71
6/11/2021
82
6/12/2021
78
6/15/2021
100
6/16/2021
75
6/28/2021
74
6/29/2021
82
7/1/2021
83
7/8/2021
76
7/13/2021
71
7/17/2021
74
7/19/2021
77
7/20/2021
78
7/21/2021
72
7/22/2021
72
8/2/2021
78
8/3/2021
79
8/4/2021
79
8/5/2021
71
8/25/2021
78
8/26/2021
76
8/27/2021
81
8/28/2021
72
8/29/2021
72
8/30/2021
72
9/3/2021
71
9/4/2021
80
9/5/2021
72
Date
µg/m3
-
Date
µg/m3
1/1/2021
104.6
Date
ppb
5/5/2021
72
5/6/2021
78
5/12/2021
74
5/13/2021
72
5/24/2021
73
5/26/2021
71
5/27/2021
74
5/28/2021
72
6/11/2021
86
6/12/2021
73
6/15/2021
107
6/18/2021
72
7/1/2021
71
7/19/2021
74
7/20/2021
72
7/21/2021
74
7/22/2021
77
7/27/2021
80
7/28/2021
79
8/2/2021
71
8/4/2021
76
8/5/2021
71
8/17/2021
72
9/4/2021
71
Date
µg/m3
-
Date
µg/m3
-
Date
ppb
5/6/2021
75
5/24/2021
74
6/11/2021
78
6/12/2021
74
6/15/2021
92
6/16/2021
76
7/1/2021
75
7/8/2021
78
7/17/2021
73
7/19/2021
77
7/28/2021
83
7/31/2021
72
8/3/2021
72
8/4/2021
75
8/5/2021
76
Date
µg/m3
-
Date
µg/m3
-
Date
ppb
5/6/2021
71
6/11/2021
76
6/12/2021
71
6/15/2021
89
6/16/2021
72
7/1/2021
71
7/8/2021
71
7/20/2021
73
7/22/2021
74
7/28/2021
77
8/5/2021
71
Date
µg/m3
10/12/2021
156
Date
µg/m3
-
Date
ppb
6/11/2021
72
6/15/2021
80
6/29/2021
76
7/1/2021
73
8/2/2021
74
8/3/2021
74
9/3/2021
72
Date
µg/m3
-
Date
µg/m3
1/1/2021
74.5
Date
ppb
5/24/2021
71
6/11/2021
75
6/12/2021
73
6/15/2021
96
6/16/2021
74
6/29/2021
74
7/1/2021
80
7/2/2021
71
7/8/2021
79
7/13/2021
71
7/17/2021
75
7/19/2021
78
7/20/2021
78
7/21/2021
72
7/22/2021
80
7/27/2021
75
7/28/2021
85
7/31/2021
75
8/2/2021
79
8/3/2021
80
8/4/2021
81
8/5/2021
82
8/26/2021
76
8/27/2021
75
8/28/2021
80
9/3/2021
76
9/4/2021
80
9/5/2021
77
Date
µg/m3
7/9/2021
188
10/12/2021
180
Date
µg/m3
-
Date
ppb
-
Date
µg/m3
7/9/2021
182
8/28/2021
207
10/12/2021
162
Date
µg/m3
-
Date
ppb
6/11/2021
73
6/12/2021
77
6/15/2021
83
6/29/2021
78
7/1/2021
86
7/17/2021
78
7/22/2021
74
7/28/2021
79
7/31/2021
75
8/2/2021
73
8/3/2021
79
8/4/2021
76
8/5/2021
73
8/24/2021
73
8/27/2021
74
8/28/2021
78
9/3/2021
80
9/4/2021
79
9/5/2021
74
Date
µg/m3
7/9/2021
208
10/12/2021
158
Date
µg/m3
1/1/2021
47.1
Date
ppb
-
Date
µg/m3
-
Date
µg/m3
1/1/2021
113.4
Date
ppb
-
Date
µg/m3
3/3/2021
177
10/12/2021
166
Date
µg/m3
-
Date
ppb
5/24/2021
71
7/1/2021
81
7/17/2021
73
7/28/2021
76
7/31/2021
73
8/2/2021
74
8/3/2021
72
9/3/2021
72
Date
µg/m3
7/9/2021
166
10/11/2021
160
10/12/2021
181
Date
µg/m3
-
Date
ppb
6/15/2021
76
6/29/2021
78
7/1/2021
74
7/8/2021
72
7/19/2021
72
7/20/2021
73
7/28/2021
76
8/2/2021
77
8/3/2021
81
8/4/2021
78
9/4/2021
78
Date
µg/m3
1/1/2021
250
Date
µg/m3
1/1/2021
222.4
1/2/2021
36.4


For now, PM

10 is forecast in the Moderate Air Quality Index (AQI) category each day. This is primarily to account for industrial activity south/southwest of the Phoenix metro area, particularly in the mornings. Elsewhere around the Valley will most likely see PM10 remain in the Good AQI category


Dust-wise, PM-10 (dust) levels are expected to be elevated in the morning hours each day, highest in industrial areas south/southwest of the Phoenix metro area. However, warmer afternoon temperatures will help to mix out PM-10 from the mornings.

Air Quality Hourly Forecast | Phoenix

Click on each day to view forecast.
 

No comments:

Joe Rogan Experience #2254 - Mel Gibson