 |
- Andrew Freedman, author ofAxios Generate
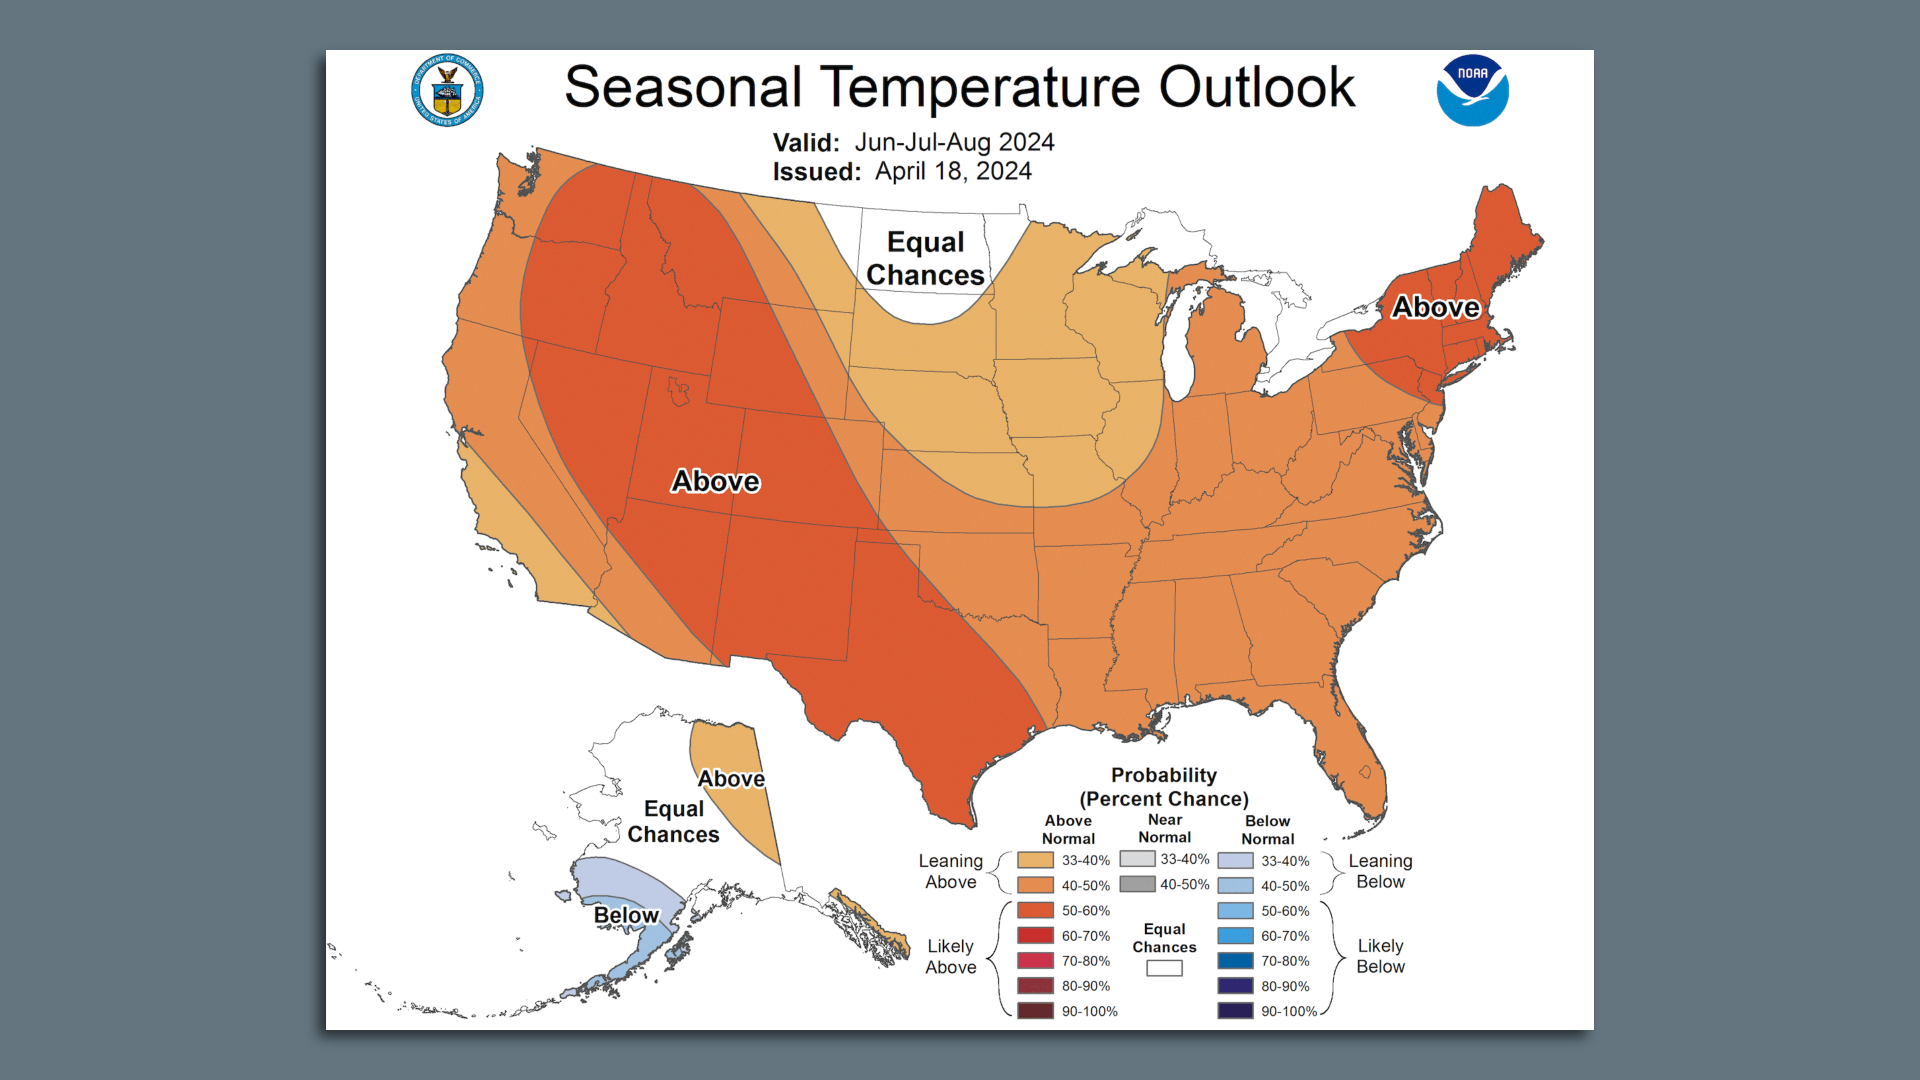
Map showing the likelihood of above, average, and below average temperatures across the U.S. during June, July and August 2024. Photo: NOAA/CPC
_________________________________________________________________________________
|
_________________________________________________________________________________________________
A hotter-than-usual summer is likely to occur in the U.S. and many other parts of the globe, according to new forecasts and scientific research.
Why it matters: Extreme heat is a major public health threat and plays a role in droughts and wildfires.
- Hot weather, particularly when it occurs during prolonged heat waves, also threatens the reliability of the nation's increasingly strained electricity grid.
The big picture: An ongoing El Niño event in the tropical Pacific Ocean is quickly fading, with cooling ocean temperatures at and beneath the surface.
- A La Niña climate cycle is expected to take shape, which features cooler-than-average tropical Pacific Ocean temperatures, later this summer.
- Some studies show that these transitions are associated with hotter-than-average summertime conditions across large parts of the U.S., centered across the Midwest.
- The transition will also influence conditions around the globe, as the planet nears its 11th straight month with record warm temperatures.
What they're saying: Michelle L'Heureux, who leads the forecasting unit that predicts El Niño and La Niña at NOAA's Climate Prediction Center in Maryland, told Axios that other climate trends — including human-caused climate change — may outrank the see-saw from El Niño to La Niña as the dominant driver of U.S. summer temperature anomalies.
- "Clearly, greenhouse gases are the #1 primary driver of climate trends over the U.S.," she told Axios in an email.
- She noted that El Niño and La Niña tend to have their greatest influence on U.S. weather patterns during the winter months in the Northern Hemisphere.
Zoom in: A recently released NOAA climate outlook for the June through August meteorological summer shows only one whole state — North Dakota — in the Lower 48 with equal chances of below-average, average or above-average temperatures.
- Everywhere else in the region is projected to be hotter than average, but with varying odds.
- The chances for hotter-than-average conditions are highest in the Northeast, and across a vast swath of land from Texas to the Rockies into the Pacific Northwest.
- The Plains and West are projected to see below-average rainfall, which could lead to higher wildfire risks, while the East stays soggy.

Threat level: The ways climate change is altering the character of American summers increasingly stands out, and is one reason to take note given the hotter-than-average outlook.
- During the past several decades, summers have been warming across the U.S., with Austin, Texas, now seeing an average of 47 additional 100°F or higher days than the city saw in 1970, for example.
- Many other cities have seen similar jumps in 90°F days, along with a tendency toward longer, hotter and more humid heat waves.
- Climate attribution studies have found that more heat waves are occurring currently. They would have been virtually impossible without the influence of human-caused climate change.
The intrigue: One wild card this summer will be exactly where persistent areas of high pressure, also known as heat domes, set up. That will determine the areas that see some of the hottest conditions.
- Some research suggests there may be a tendency for that to occur across the Central states and Midwest.
Yes, but: Anthony Artusa, a meteorologist at CPC, pushed back against recent media headlines suggesting the lower 48 could see its "hottest summer ever" in 2024.
- "Nevertheless, what [models] do support is an unusually hot summer this year, especially for the south-central and western areas of the contiguous U.S., and people should be prepared for this," he said.
Between the lines: This summer, the National Weather Service will have an added weapon in its arsenal to try to combat the deadly effects of extreme heat.
National Weather Service Climate Prediction Center
- Working with the Centers for Disease Control and Prevention, NWS expanded out a new heat forecast tool Monday.
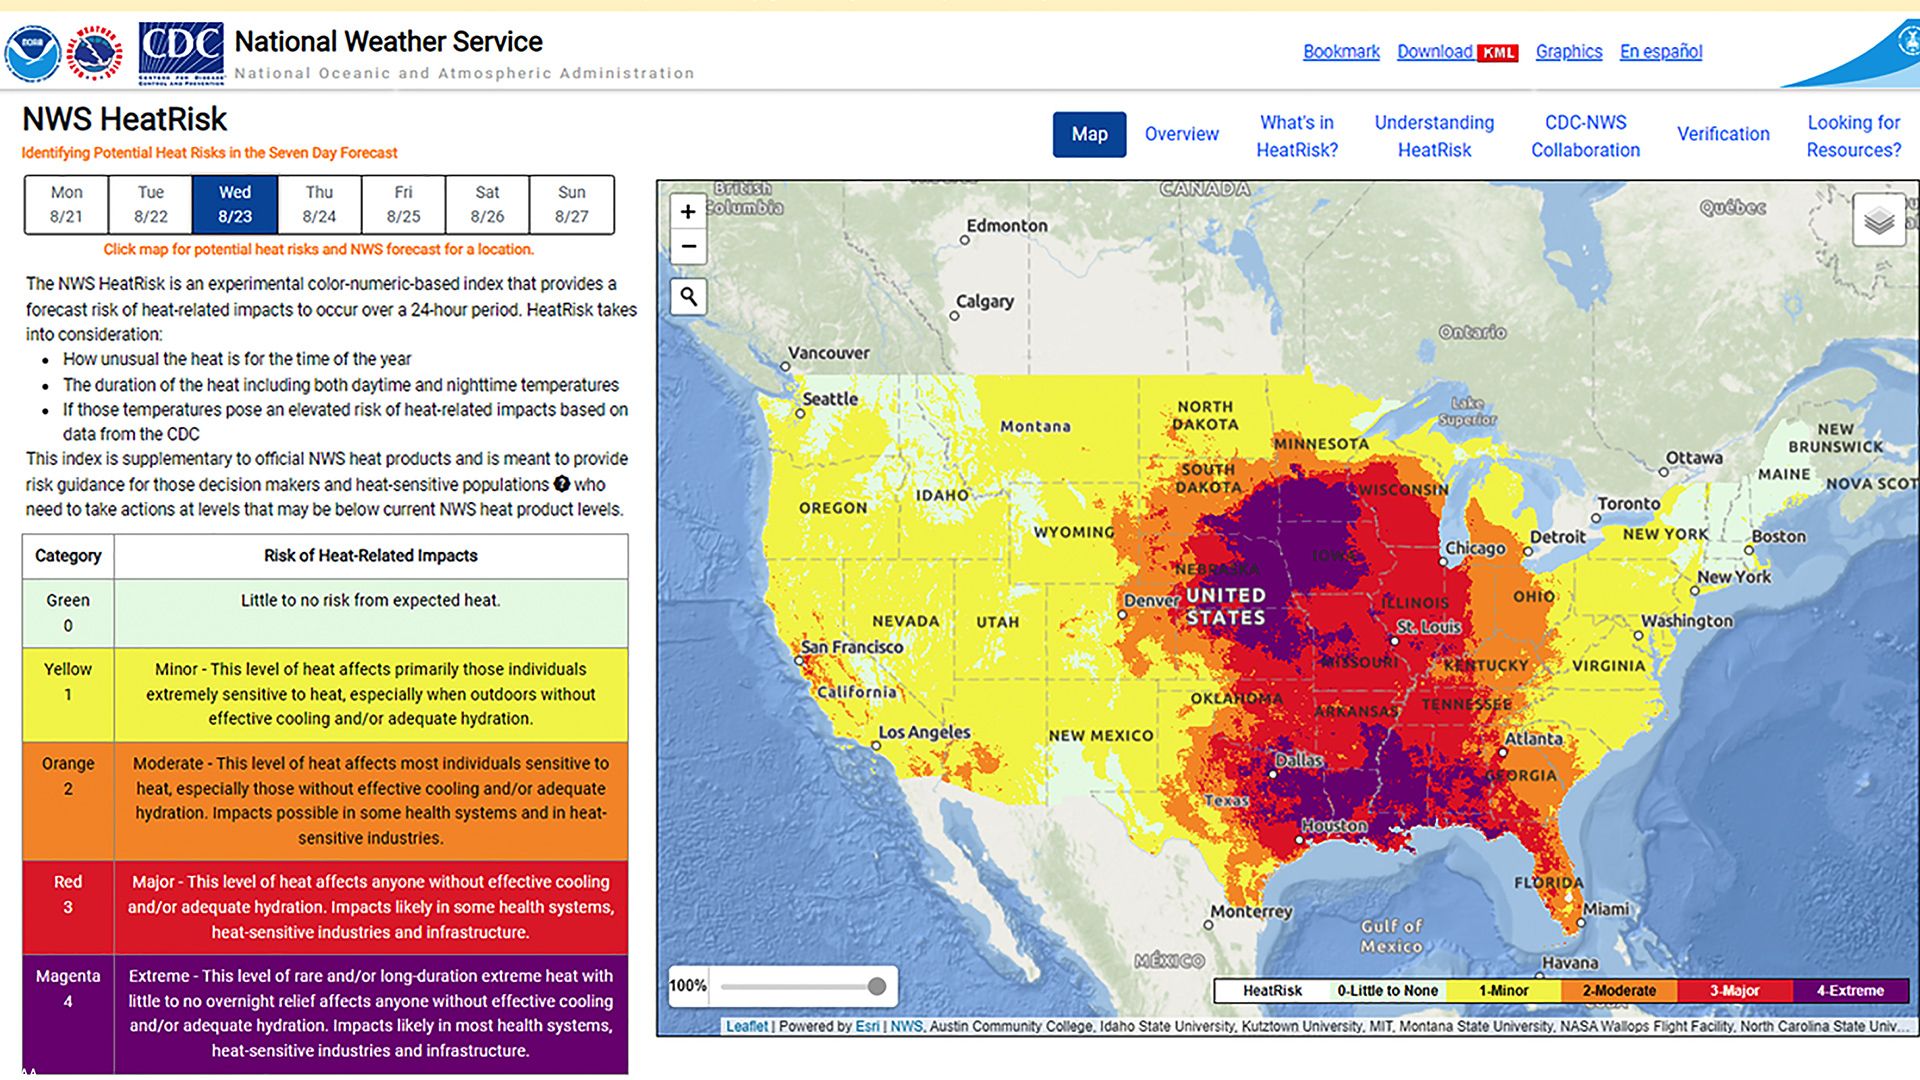
- The "HeatRisk" forecast has a color-coded scale that is aimed at communicating the health risks from heat exposure.
- It incorporates the rarity of the heat, its likely duration, and the chances for heat-related health impacts, based on CDC data.
This forecast product, still in an experimental phase, goes out to seven days in advance.


No comments:
Post a Comment