|
EMBARGOED UNTIL RELEASE AT 10:00 a.m. EST, Friday, December 20, 2024
Gross Domestic Product by State and Personal Income by State, 3rd Quarter 2024
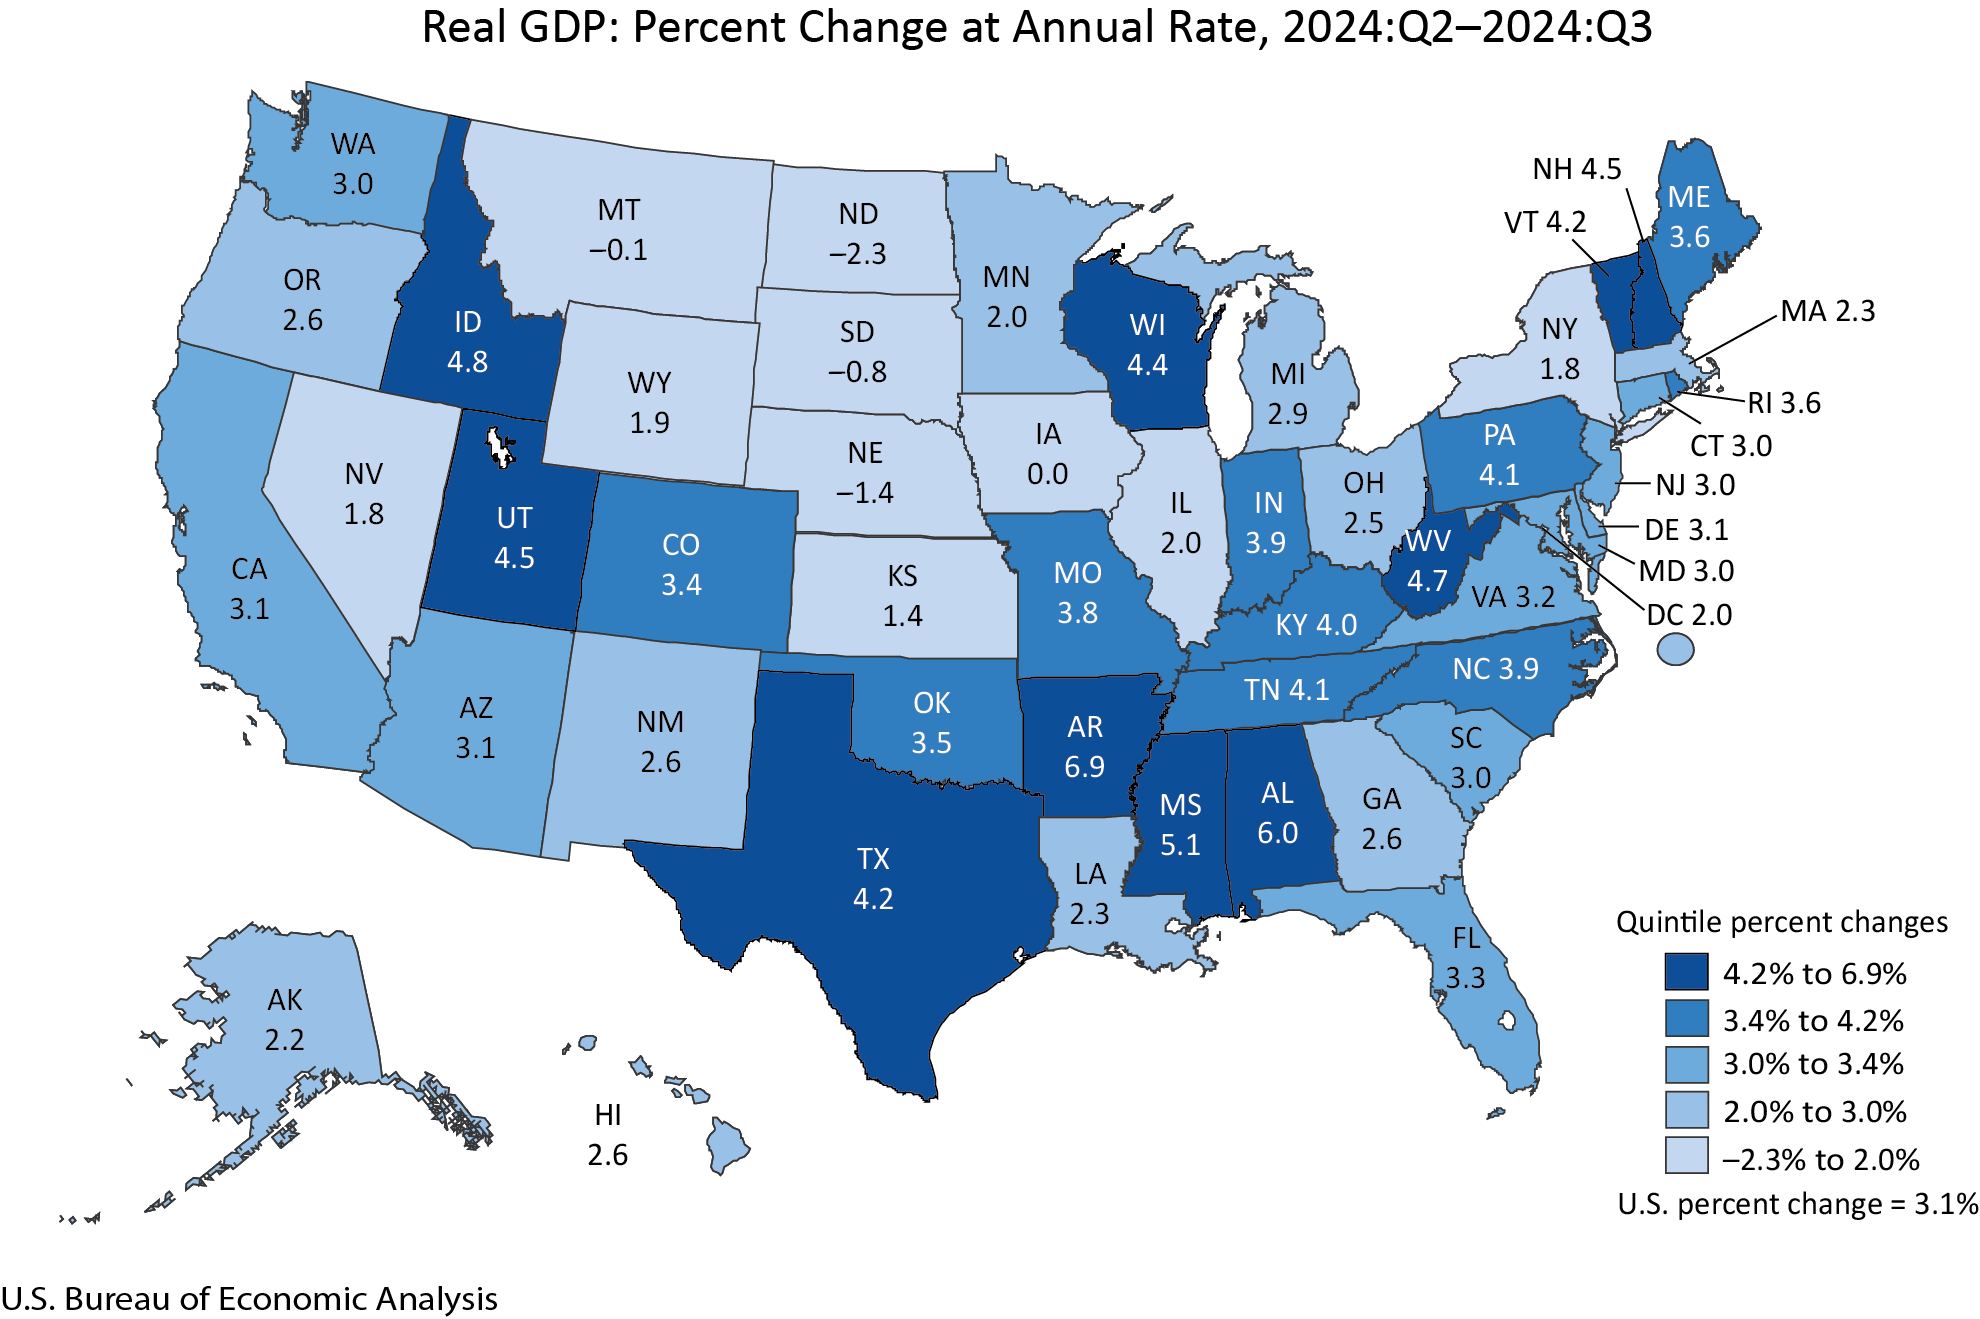
Real gross domestic product increased in 46 states and the District of Columbia in the third quarter of 2024, with the percent change ranging from 6.9 percent at an annual rate in Arkansas to –2.3 percent in North Dakota, according to statistics released today by the U.S. Bureau of Economic Analysis (table 1).
Current-dollar gross domestic product (GDP) increased in 49 states and the District of Columbia, with the percent change ranging from 8.9 percent at an annual rate in Arkansas to –2.6 percent in North Dakota (table 1).
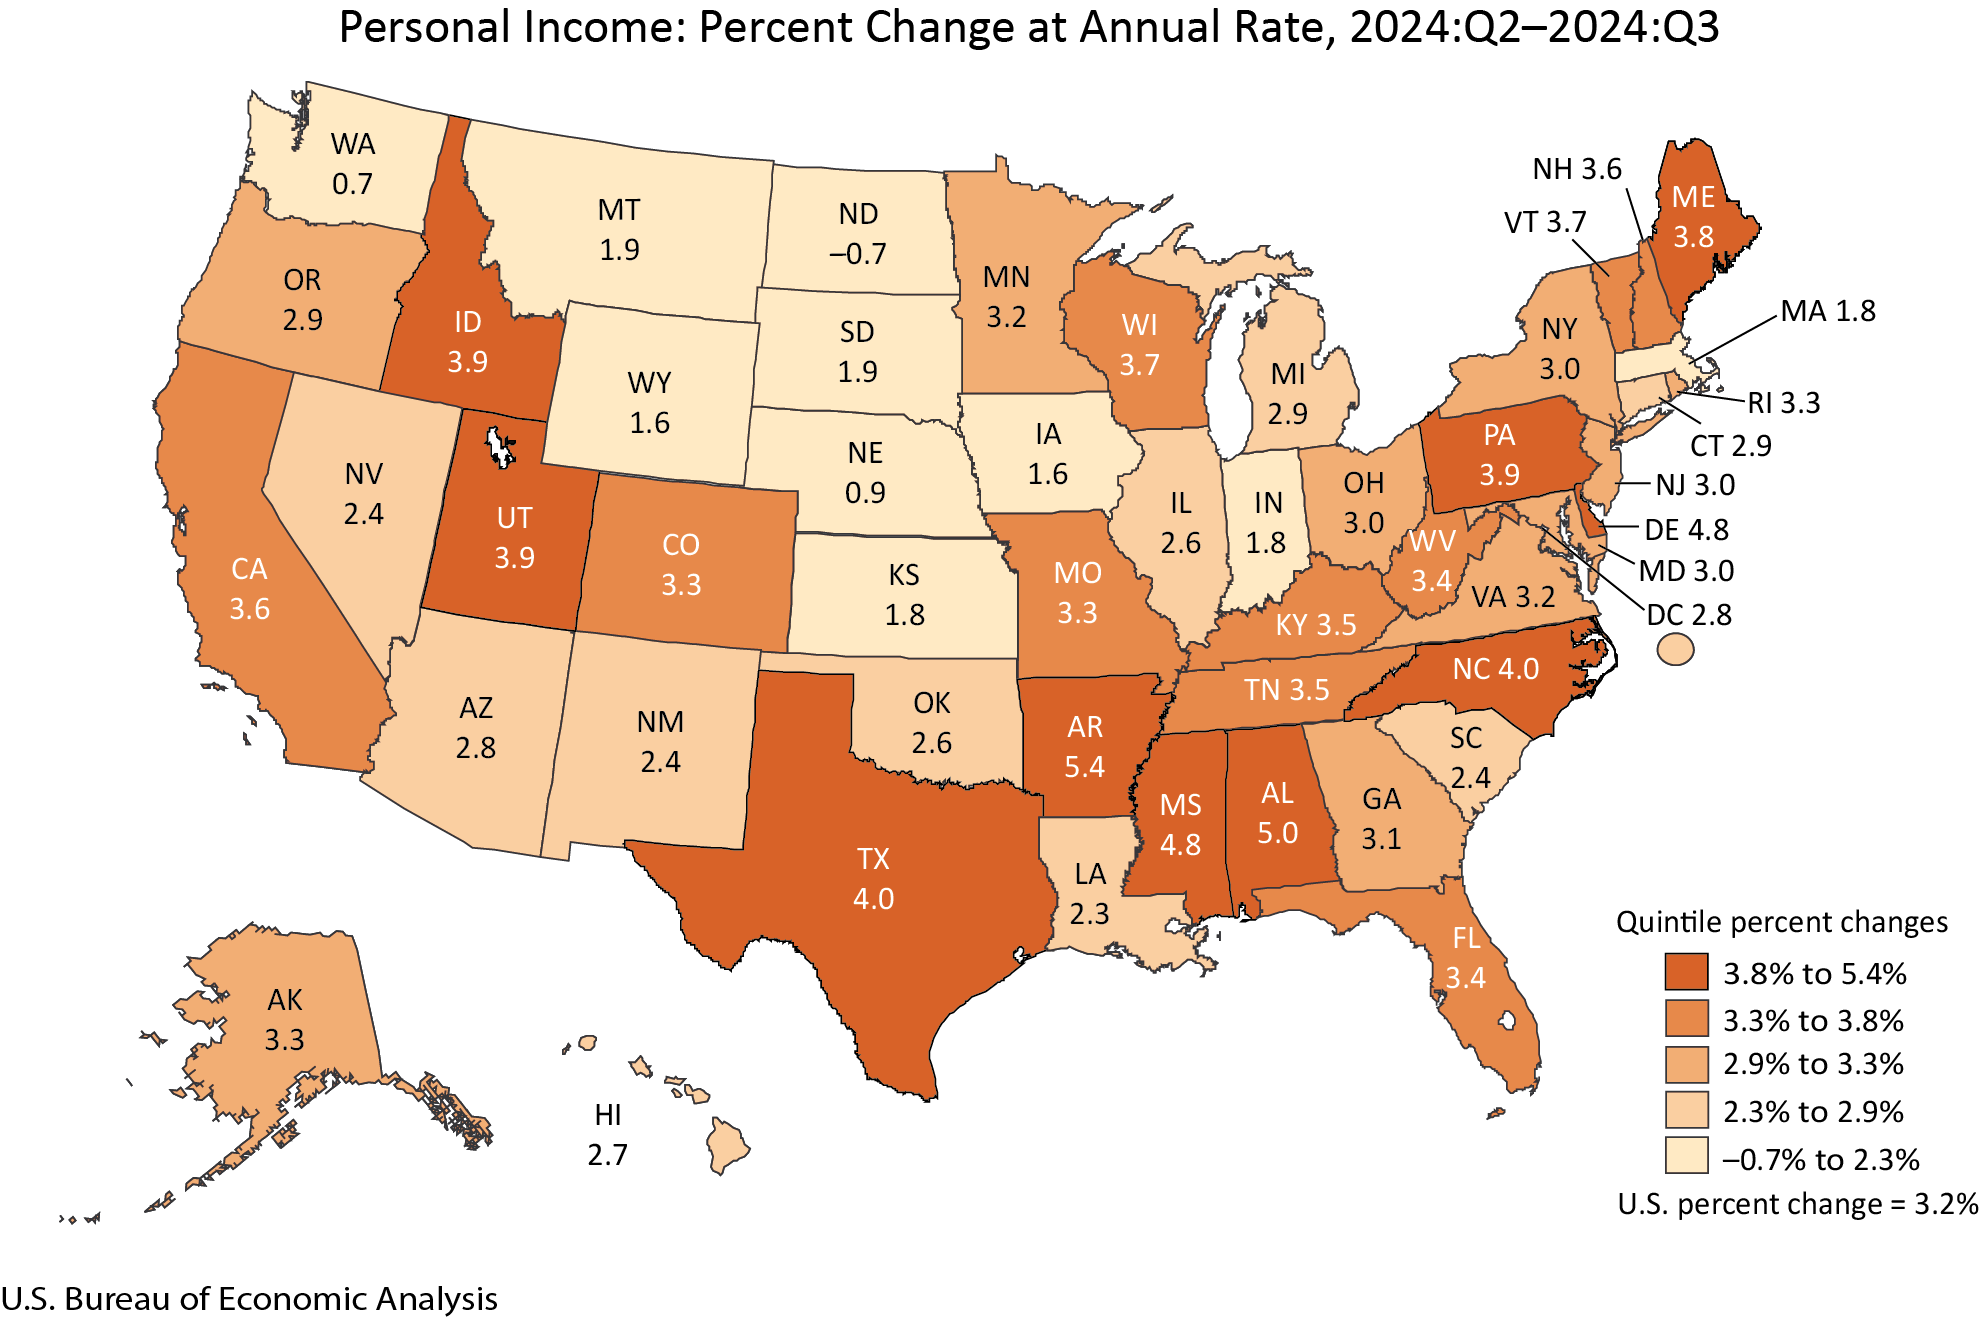
Personal income, in current dollars, increased in 49 states and the District of Columbia, with the percent change ranging from 5.4 percent at an annual rate in Arkansas to –0.7 percent in North Dakota (table 3).
Real GDP
In the third quarter of 2024, real GDP for the nation grew at an annual rate of 3.1 percent. Real GDP increased in 16 of the 23 industry groups for which BEA prepares quarterly state estimates. Retail trade, health care and social assistance, and information were the leading contributors to growth in real GDP nationally (table 2).
- Agriculture, forestry, fishing, and hunting, which increased in 25 states, was the leading contributor to growth in five states including Arkansas, Alabama, and Mississippi, the states with the largest increases in real GDP. In contrast, this industry was the leading offset to growth in 14 states including North Dakota, Nebraska, South Dakota, and Montana, the only states with declines in real GDP.
- Retail trade, which increased in all 50 states and the District of Columbia, was the leading contributor to growth in 39 states including Idaho, the state with the fourth-largest increase in real GDP.
- Mining, which increased in 17 states, was the leading contributor to growth in West Virginia, the fifth-largest growing state.
Personal income
In the third quarter of 2024, current-dollar personal income increased $191.4 billion, or 3.2 percent at an annual rate (table 3). Nationally, increases in earnings and transfer receipts were partially offset by a decrease in property income (dividends, interest, and rent) (chart 1).
Earnings increased in 49 states and the District of Columbia, while growing 3.8 percent nationally. The percent change in earnings ranged from 10.5 percent in Arkansas to –1.9 percent in North Dakota. Earnings increased in 17 of the 24 industries for which BEA prepares quarterly estimates and was the largest contributor to growth in personal income in 47 states and the District of Columbia (tables 4 and 5).
- Farm earnings, which increased in 33 states, was the leading contributor to the increase in Arkansas, Alabama, Delaware, and Mississippi, the four states with the largest growth in personal income. In contrast, a decrease in farm earnings was the leading offset to growth in North Dakota, the only state with a decrease in personal income.
- In North Carolina, the state with the fifth-largest growth in personal income, professional, scientific, and technical services was the leading contributor to the increase in earnings.
- In Texas, the state with the sixth-largest growth in personal income, finance and insurance was the leading contributor to the increase in earnings.
Transfer receipts increased in all 50 states and the District of Columbia, while growing 5.2 percent nationally. The percent change in transfer receipts ranged from 7.8 percent in South Dakota to 1.6 percent in New Mexico (table 4). The increase in transfer receipts in South Dakota was due in part to an increase in Medicaid benefits, which increased 22.0 percent.
Property income decreased in all 50 states and the District of Columbia, while declining 0.7 percent nationally. The percent change ranged from –0.2 percent in West Virginia to –1.3 percent in Arkansas, Nebraska, and South Dakota (table 4).
Update of state statistics
Today, BEA also released revised quarterly estimates of personal income by state for the first and second quarters of 2024. This update incorporates new and revised source data that are more complete and more detailed than previously available and aligns the states with the national estimates from the National Income and Product Accounts released on December 19, 2024.
BEA also released new estimates of per capita personal income for the third quarter of 2024, along with revised estimates for the first quarter of 2024 through the second quarter of 2024. BEA used U.S. Census Bureau population figures to calculate per capita personal income estimates for the first quarter of 2020 through the third quarter of 2024. For earlier estimates, BEA continues to use intercensal population statistics that it developed based on Census Bureau methodology. See “Note on Per Capita Personal Income and Population.”
Note on state statistics
BEA’s state quarterly estimates of wages and salaries are prepared using industry-level data from the Quarterly Census of Employment and Wages (QCEW) from the U.S. Bureau of Labor Statistics (BLS). The QCEW is administered as part of each state’s unemployment insurance system. On November 20, 2024, BLS suspended publication of industry-level QCEW data for Colorado due to concerns regarding data quality, which affected data for the second quarter of 2024. BLS will resume publication of the industry-level data once these concerns have been addressed. Due to the unavailability of industry-level QCEW wages, BEA used the all-industry QCEW wage data to prepare state quarterly estimates of wages and salaries for Colorado starting in the second quarter of 2024.
Next release: March 28, 2025, at 10:00 a.m. EDT


No comments:
Post a Comment