|

|
News Release
Gross Domestic Product by State and Personal Income by State, 3rd Quarter 2025
 New combined national and state news release
Starting April 9, 2026,
Today, the U.S. Bureau of Economic Analysis released new quarterly statistics on gross domestic product and personal income for all 50 states and the District of Columbia for the third quarter of 2025 (July, August, and September).
Gross domestic product (GDP) highlights
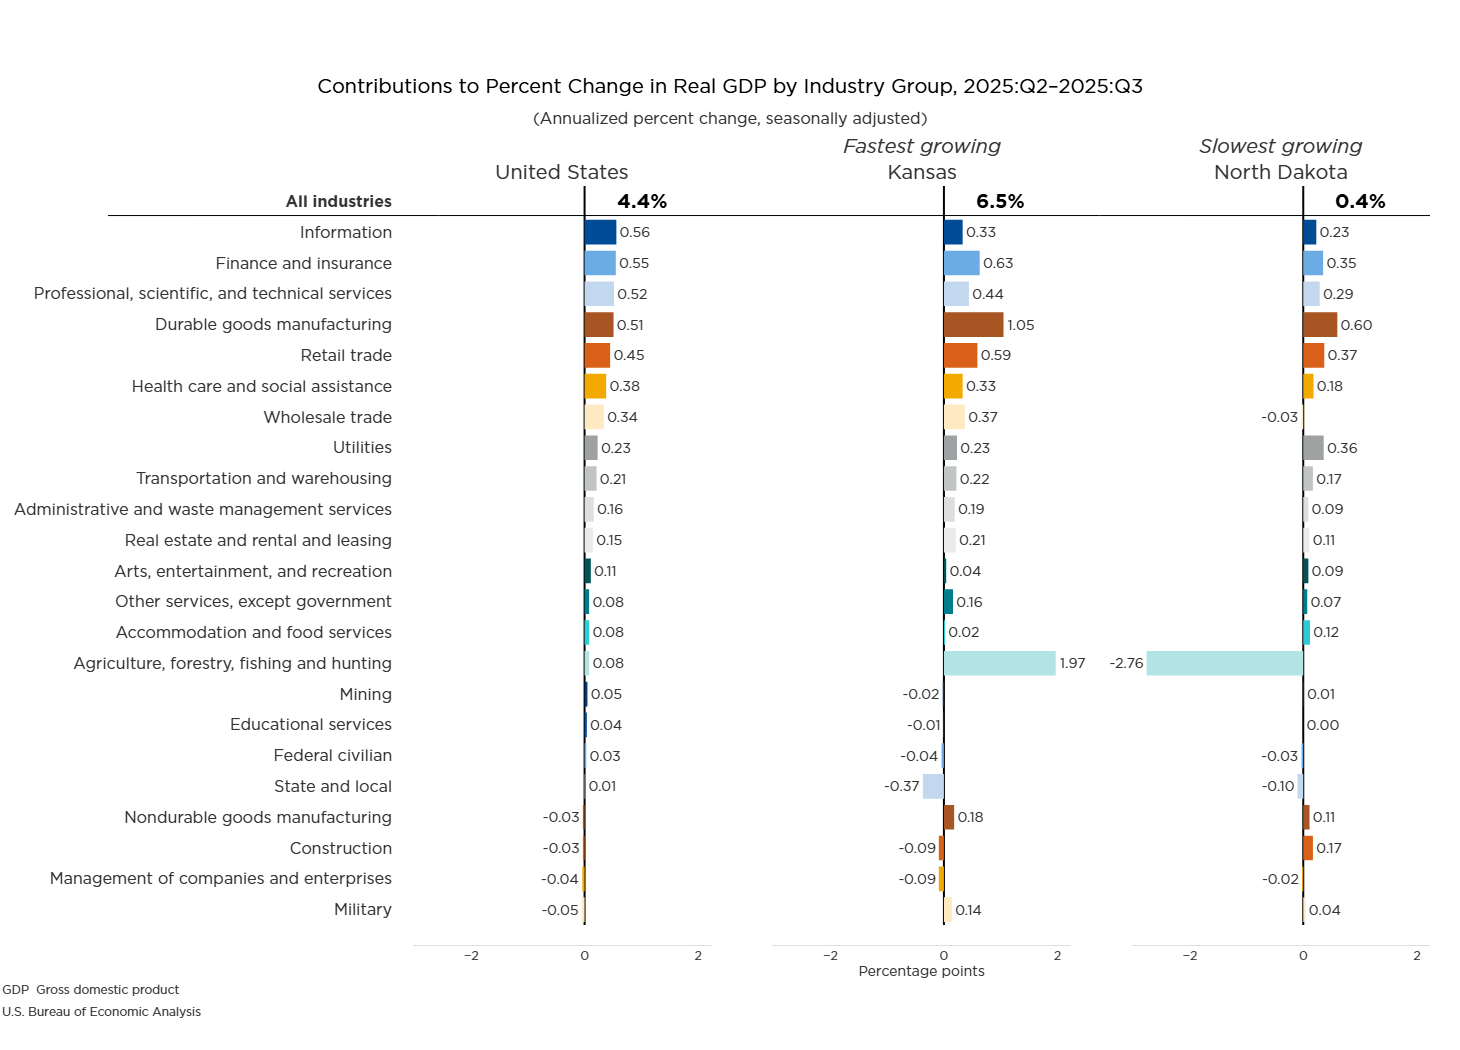
Real GDP increased in all 50 states and District of Columbia in the third quarter of 2025. Real GDP increased at an annual rate of 4.4 percent nationally and ranged from 6.5 percent in Kansas to 0.4 percent in North Dakota.

- These industries were the leading contributors to real GDP growth in nearly half the states.
- Durable-goods manufacturing also impacted real GDP growth in several states.
- Agriculture, forestry, fishing, and hunting increased in 34 states and was the leading contributor to growth in Kansas and South Dakota, the states with the first- and second-largest increases in real GDP, respectively.
- Durable-goods manufacturing increased in all 50 states and the District of Columbia and was the leading contributor to growth in 13 states including Arkansas and Connecticut, the states with the third- and fourth-largest increases in real GDP, respectively.
Current-dollar GDP increased in all 50 states and the District of Columbia. Current-dollar GDP increased at an annual rate of 8.3 percent nationally and ranged from 10.5 percent in Kansas to 2.6 percent in North Dakota.
Personal income highlights
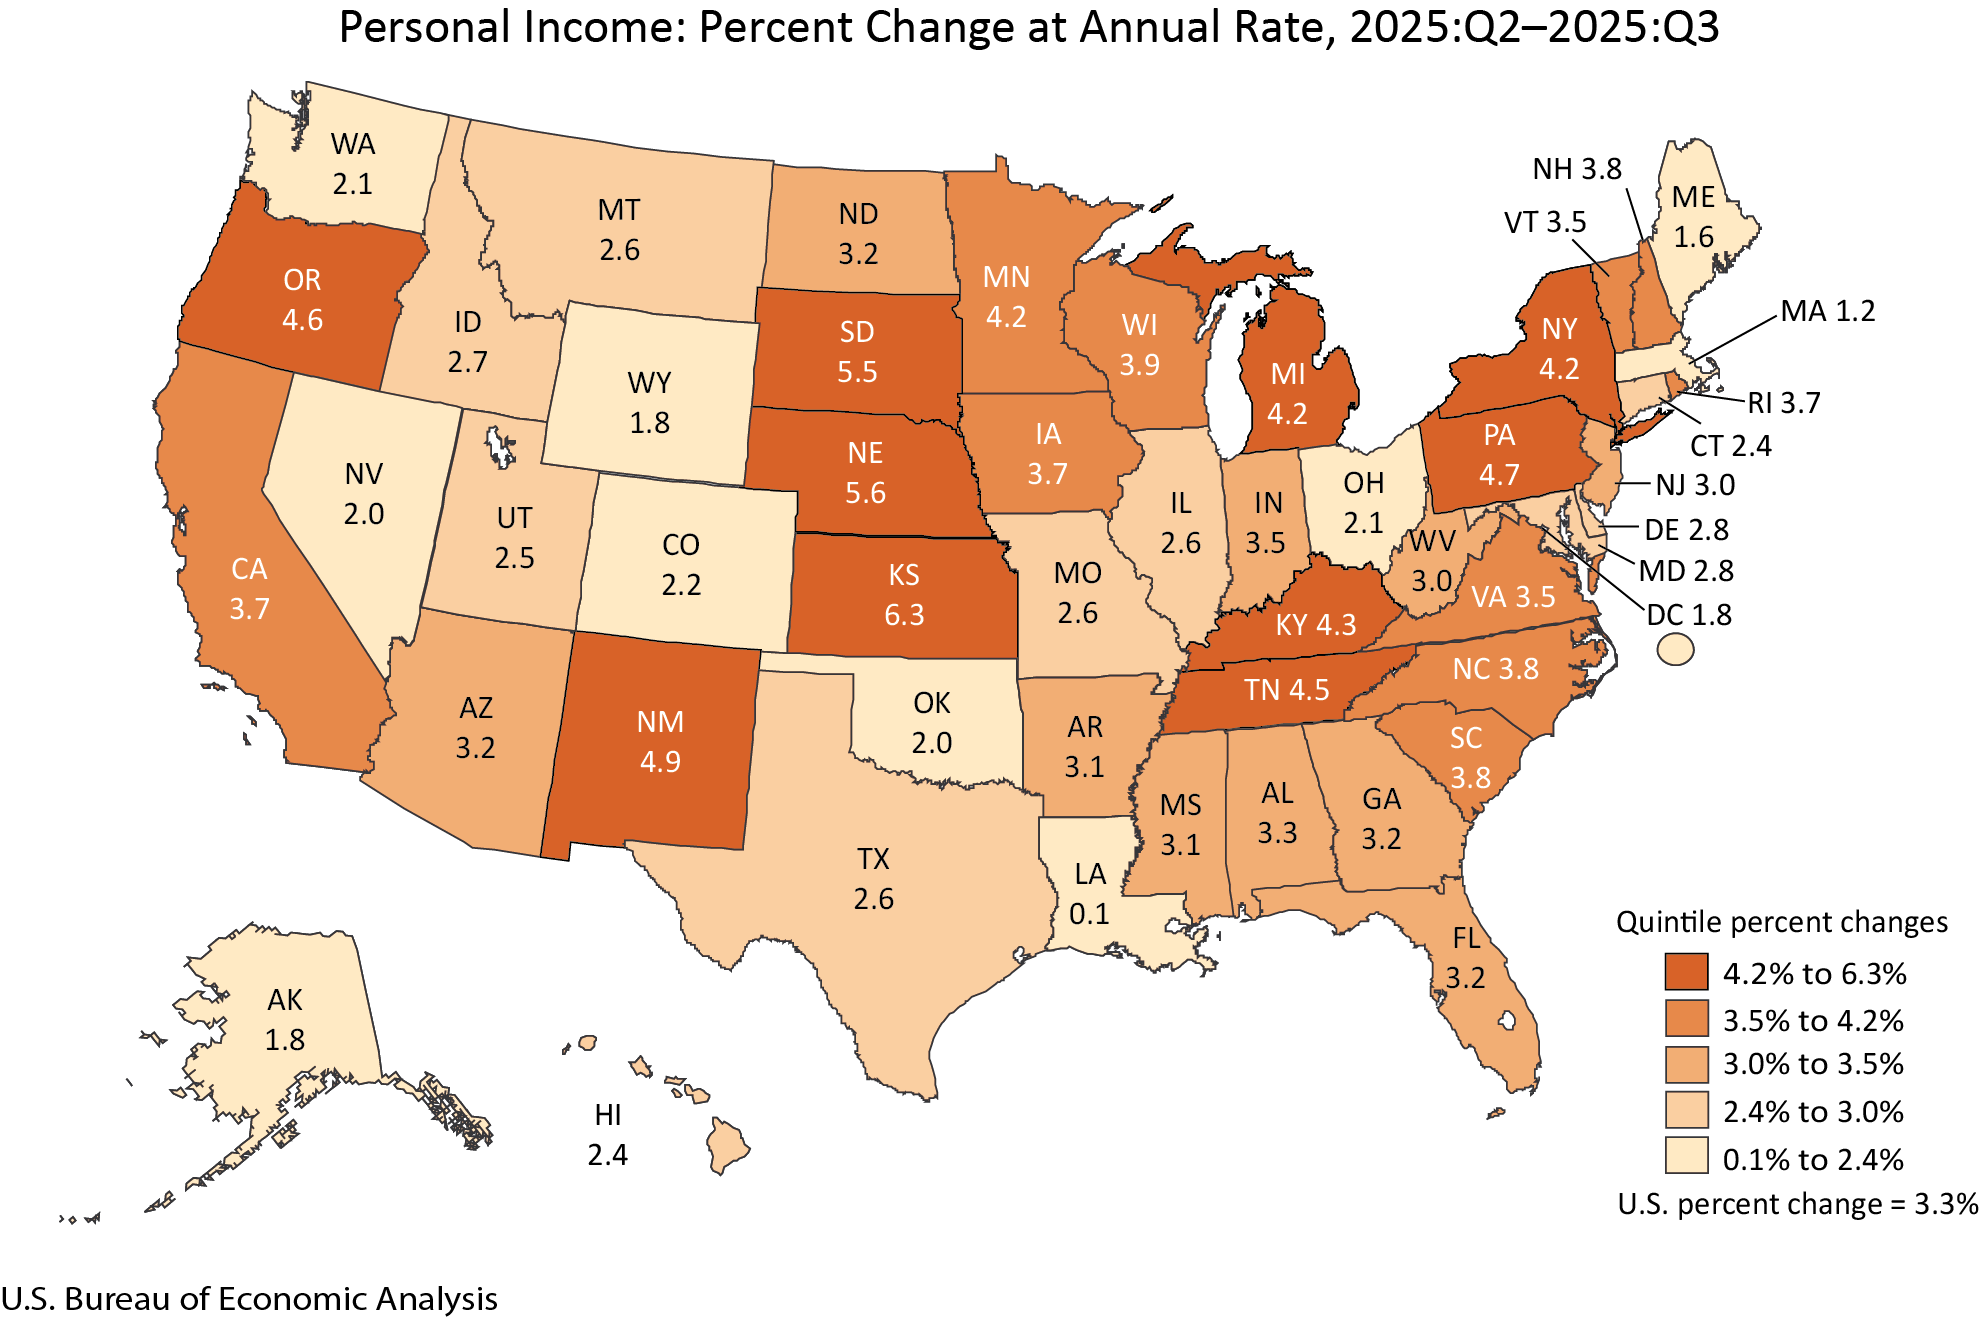
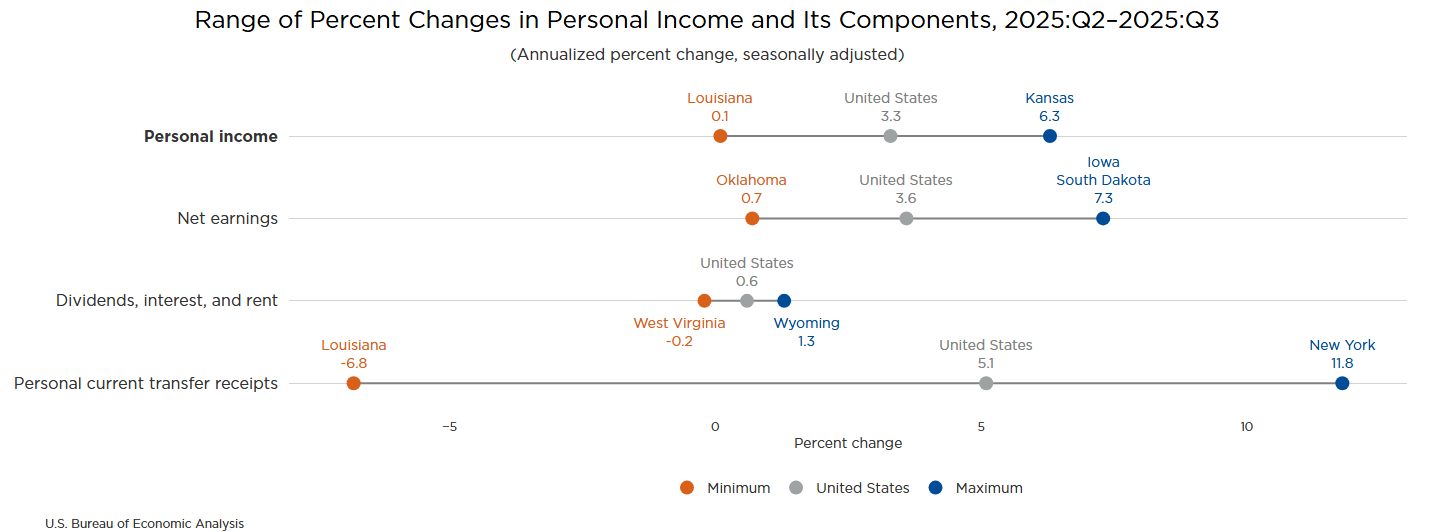
In the third quarter of 2025, all components of personal income—earnings, transfer receipts, and property income (dividends, interest, and rent)—contributed to the increase in personal income nationally. Earnings increased in all 50 states and the District of Columbia.
- Earnings increased 3.6 percent nationally, ranging from 7.3 percent in Iowa and South Dakota to 0.7 percent in Oklahoma. Earnings was the largest contributor to growth in personal income in 46 states and the District of Columbia.
- Transfer receipts increased 5.1 percent nationally, with state-level changes in transfer receipts ranging from an 11.8 percent increase in New York to a 6.8 percent decrease in Louisiana. The increase in transfer receipts was due to increases in Medicaid payments and Medicare benefits, while Social Security payments offset the increase.
- Property income increased 0.6 percent nationally, with state-level changes in property income ranging from a 1.3 percent increase in Wyoming to a 0.2 percent decrease in West Virginia.
Update of state statistics
Today, BEA also released revised quarterly estimates of personal income by state for the first and second quarters of 2025. This update incorporates new and revised source data that are more complete and more detailed than previously available and aligns the states with the national estimates from the National Income and Product Accounts released on January 22, 2026.
BEA also released new estimates of
per capita personal income for the third quarter of 2025, along with
revised estimates for the first quarter of 2025 through the second
quarter of 2025. BEA used U.S. Census Bureau population figures to
calculate per capita personal income estimates.
New combined national and state news release

- During every third estimate release of U.S. GDP, BEA will release GDP, GDP by industry, and corporate profits along with state estimates of GDP and personal income.
- This combined release will provide a fuller picture of the economies of the nation, all states, and the District of Columbia and will replace the publication of two separate releases issued on different days.

Note.
With the release of fourth-quarter 2025 and preliminary annual 2025 GDP
by state and personal income by state statistics on April 9, 2026, the
third-quarter data will be superseded and can then be accessed in BEA’s Data Archive
Recent changes in the presentation of tables
- Data previously published as tables within the quarterly news releases of GDP and personal income are updated and available simultaneously with today’s release in BEA’s online Interactive Data Application.
- Tables are no longer included with the body of the news release.
- This reduces duplication, increases efficiency, and points data users directly to BEA’s most complete and flexible data tables, via links in the release.
- These customizable tables include full time series and can be downloaded as PDFs, in Excel, or in CSV format.
Related Interactive Data Tables
For the third-quarter 2025 GDP and personal income by state statistics highlighted in this release, as well as historical time series for these estimates, see the below data tables in BEA’s Interactive Data Application.
GDP by state
Table SQGDP1. Quarterly GDP by State—Percent Change at Annual Rates From Preceding Period in Real GDP
Table SQGDP1. Quarterly GDP by State—Percent Change at Annual Rates From Preceding Period in Current-Dollar GDP
Table SQGDP11. Industry Contributions to Percent Change in Real GDP by State
Personal income by state
Table SQINC1. Quarterly Personal Income by State—Percent Change at Annual Rates From Preceding Period
Table SQINC12. Personal Income Change by Component
Next release: April 9, 2026, at 8:30 a.m. EDT
GDP (Third Estimate), Industries, Corporate Profits, State GDP, and State Personal Income, 4th Quarter and Year 2025


No comments:
Post a Comment