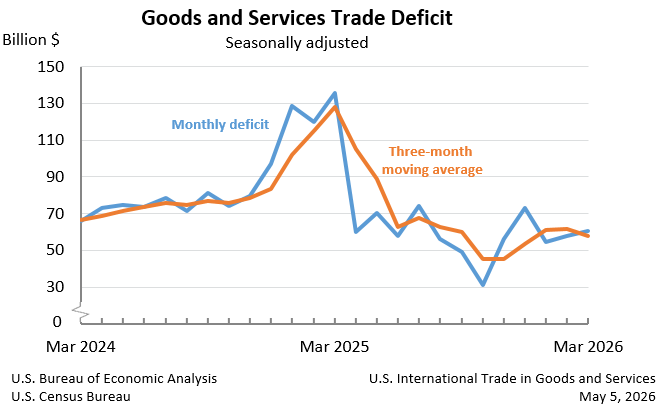
The U.S. Census Bureau and the U.S. Bureau of Economic Analysis announced today that the goods and services deficit was $60.3 billion in March, up $2.5 billion from $57.8 billion in February, revised.
U.S. International Trade in Goods and Services Deficit| Deficit: | $60.3 Billion | +4.4%° |
| Exports: | $320.9 Billion | +2.0%° |
| Imports: | $381.2 Billion | +2.3%° |
Next release: Tuesday, June 9, 2026 (°) Statistical significance is not applicable or not measurable. Data adjusted for seasonality but not price changes Source: U.S. Census Bureau, U.S. Bureau of Economic Analysis; U.S. International Trade in Goods and Services, May 5, 2026 |
Exports, Imports, and Balance (exhibit 1)
March
exports were $320.9 billion, $6.2 billion more than February exports.
March imports were $381.2 billion, $8.7 billion more than February
imports.
The March increase in the goods and services deficit
reflected an increase in the goods deficit of $4.1 billion to $88.7
billion and an increase in the services surplus of $1.6 billion to $28.4
billion.
Year-to-date, the goods and services deficit decreased
$211.2 billion, or 55.0 percent, from the same period in 2025. Exports
increased $100.2 billion or 12.0 percent. Imports decreased $111.0
billion or 9.1 percent.
Three-Month Moving Averages (exhibit 2)
The average goods and services deficit decreased $4.2 billion to $57.6 billion for the three months ending in March.
- Average exports increased $11.5 billion to $312.6 billion in March.
- Average imports increased $7.3 billion to $370.2 billion in March.
Year-over-year, the average goods and services deficit decreased $70.4 billion from the three months ending in March 2025.
- Average exports increased $33.4 billion from March 2025.
- Average imports decreased $37.0 billion from March 2025.
Exports (exhibits 3, 6, and 7)
Exports of goods increased $6.5 billion to $213.5 billion in March.
Exports of goods on a Census basis increased $6.2 billion.
- Industrial supplies and materials increased $5.0 billion.
- Crude oil increased $2.8 billion.
- Other petroleum products increased $1.7 billion.
- Fuel oil increased $1.6 billion.
- Other precious metals decreased $1.6 billion.
- Foods, feeds, and beverages increased $1.1 billion.
- Soybeans increased $0.9 billion.
- Consumer goods decreased $1.7 billion.
Net balance of payments adjustments increased $0.3 billion.
Exports of services decreased $0.3 billion to $107.4 billion in March.
- Travel decreased $1.1 billion.
- Transport increased $0.2 billion.
- Financial services increased $0.1 billion.
- Other business services increased $0.1 billion.
Imports (exhibits 4, 6, and 8)
Imports of goods increased $10.6 billion to $302.2 billion in March.
Imports of goods on a Census basis increased $10.2 billion.
- Automotive vehicles, parts, and engines increased $3.6 billion.
- Passenger cars increased $2.8 billion.
- Consumer goods increased $2.4 billion.
- Capital goods increased $2.1 billion.
- Computer accessories increased $2.0 billion.
- Computers decreased $2.3 billion.
- Industrial supplies and materials increased $2.1 billion.
Net balance of payments adjustments increased $0.4 billion.
Imports of services decreased $1.9 billion to $79.0 billion in March.
- Charges for the use of intellectual property decreased $1.0 billion.
- Transport decreased $0.4 billion.
- Travel decreased $0.4 billion.
Real Goods in 2017 Dollars – Census Basis (exhibit 11)
The
real goods deficit increased $5.7 billion, or 6.7 percent, to $90.8
billion in March, compared to a 4.7 percent increase in the nominal
deficit.
- Real
exports of goods increased $1.9 billion, or 1.2 percent, to $163.0
billion, compared to a 3.0 percent increase in nominal exports.
- Real
imports of goods increased $7.6 billion, or 3.1 percent, to $253.8
billion, compared to a 3.5 percent increase in nominal imports.
Revisions
Revisions to February exports
- Exports of goods were revised up $0.1 billion.
- Exports of services were revised down $0.2 billion.
Revisions to February imports
- Imports of goods were revised up $0.1 billion.
- Imports of services were revised up $0.2 billion.
Goods by Selected Countries and Areas: Monthly – Census Basis (exhibit 19)
The
March figures show surpluses, in billions of dollars, with Netherlands
($7.4), United Kingdom ($6.1), Hong Kong ($5.8), South and Central
America ($5.0), Switzerland ($4.3), Australia ($2.2), Singapore ($1.9),
Brazil ($1.4), and Belgium ($0.6). Deficits were recorded, in billions
of dollars, with Taiwan ($20.6), Vietnam ($19.2), Mexico ($16.4), China
($14.0), European Union ($9.2), Germany ($5.0), South Korea ($4.8),
Japan ($4.1), Malaysia ($4.0), India ($3.8), Canada ($3.6), Ireland
($2.9), Italy ($2.3), Saudi Arabia ($0.7), and Israel ($0.4).
- The
deficit with the European Union increased $4.1 billion to $9.2 billion
in March. Exports decreased $0.3 billion to $37.2 billion and imports
increased $3.8 billion to $46.4 billion.
- The
surplus with Switzerland decreased $3.5 billion to $4.3 billion in
March. Exports decreased $3.9 billion to $8.2 billion and imports
decreased $0.3 billion to $3.9 billion.
- The
deficit with South Korea decreased $2.9 billion to $4.8 billion in
March. Exports increased $1.8 billion to $7.5 billion and imports
decreased $1.0 billion to $12.2 billion.
All statistics
referenced are seasonally adjusted; statistics are on a balance of
payments basis unless otherwise specified. Additional statistics,
including not seasonally adjusted statistics and details for goods on a
Census basis, are available in exhibits 1-20b of this release. For
information on data sources, definitions, and revision procedures, see
the explanatory notes in this release. The full release can be found at www.census.gov/foreign-trade/Press-Release/current_press_release/index.html or www.bea.gov/data/intl-trade-investment/international-trade-goods-and-services. The full schedule is available in the Census Bureau’s Economic Briefing Room at www.census.gov/economic-indicators/ or on BEA’s website at www.bea.gov/news/schedule.
Next release: June 9, 2026
U.S. International Trade in Goods and Services, April 2026
Notice
Upcoming Updates to Goods and Services
With
the releases of the “U.S. International Trade in Goods and Services”
report (FT-900) and the FT-900 Annual Revision on June 9, 2026,
statistics on trade in goods, on both a Census basis and a balance of
payments (BOP) basis, will be revised beginning with 2021 and statistics
on trade in services will be revised beginning with 1999. The revised
statistics for goods on a BOP basis and for services will also be
included in the “U.S. International Transactions and Investment
Position, 1st Quarter 2026 and Annual Update” report and in BEA’s Interactive Data Application, both to be released by BEA on June 24, 2026.
Revised statistics on trade in goods will reflect:
- Corrections and adjustments to previously published not seasonally adjusted statistics for goods on a Census basis.
- End-use reclassifications of several commodities.
- Recalculated seasonal and trading-day adjustments.
- Newly
available and revised source data on BOP adjustments, which are
adjustments that BEA applies to goods on a Census basis to convert them
to a BOP basis. See the “Goods (balance of payments basis)” section in
the explanatory notes for more information.
Revised statistics on trade in services will reflect:
- Newly available and revised source data, primarily from BEA surveys of international services.
- An improved estimation method for transport services.
- Corrections and adjustments to previously published not seasonally adjusted statistics.
- Recalculated seasonal adjustments.
- Revised
temporal distributions of quarterly source data to monthly statistics.
See the “Services” section in the explanatory notes for more
information.
For more information, see “Preview of the 2026 Annual Update of the International Economic Accounts” in the Survey of Current Business.
If
you have questions or need additional information, please contact the
Census Bureau, Economic Indicators Division, International Trade Macro
Analysis Branch, on 800-549-0595, option 4, or at eid.international.trade.data@census.gov or BEA, Balance of Payments Division, at InternationalAccounts@bea.gov.