COVID-19 pandemic in Arizona
The COVID-19 pandemic was confirmed to have reached the U.S. state of Arizona in January 2020.
On December 7, 2020, Arizona public health authorities reported 1,567 new COVID-19 cases and no deaths, for cumulative totals of 365,843 cases and 6,950 deaths since the start of the pandemic.[6]
> COVID-19 is currently surging in Arizona and much of the Southwest; the 7 day moving average has risen to 5,575 new cases per day, an increase of nearly 2,400 cases per day in just two weeks.[6]
In the two-month period after Governor Ducey abruptly ended Arizona's statewide lockdown on May 15, the seven-day moving average of new COVID-19 cases in Arizona soared, from an average of 377 cases per day to 3,249 cases on July 15.
> On July 8, Arizona reported as many new cases of COVID-19 as the entire European Union, while having 1/60th of the population.[7]
On June 17 Governor Ducey, under pressure due to rising COVID cases, publicly encouraged Arizona citizens to wear masks and allowed individual cities and counties to issue mask mandates.[8] No statewide mandate was issued, but most major cities and counties in AZ issued local mandates.[8] COVID-19 cases and deaths continued to rise through July, with Arizona's highest single day death toll occurring on Thursday July 30, when 172 deaths were reported.[6]
After four months during which the day over day increase in new COVID-19 cases never dropped below 1%, in August the case rate suddenly dropped dramatically, to a seven-day moving average of 489 cases per day on August 31. Despite the low case rate Arizona still has a high percentage mortality among infected individuals and a high diagnostic test positivity rate (11%).[6] Over five percent (5.09%) of all Arizona residents have been infected by the COVID-19 virus, as confirmed by PCR diagnostic testing.[6]
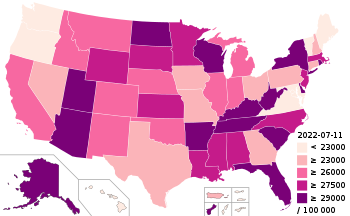
> As of October 8, 2020, Arizona had the eighth-highest number of confirmed cases in the United States, and the ninth-highest number of confirmed cases per capita, behind Louisiana, North Dakota, Mississippi, Alabama, Florida, Tennessee, Georgia, and South Dakota.[9] It has the eleventh-highest number of deaths related to the virus.[9]
------------------------------------------------------------------------------------------------------------------------------
TIMELINE
October[edit]
On October 12, San Tan Foothills High School in Pinal County was closed due to a cluster of cases.[72]
On October 13, Maricopa County Public Health reported 21 outbreaks in county school districts, with 77 cases. Nineteen schools with outbreaks remained open. An outbreak is defined as "two or more COVID-19 positive cases that don’t live in the same household." Ventilator use, inpatient admissions and ICU patients with coronavirus had nearly 40% or more statewide over the previous two weeks.[73]
On October 19, a campaign rally by President Trump near Tucson International Airport drew over 2,000 supporters.[74] Few masks were worn, despite requests by Tucson Mayor Regina Romero to heed local public health ordinances.[75] Another rally was held at the Prescott Regional Airport in Prescott.[76]
On October 22, during the presidential debate, President Trump stated "There was a very big spike in Arizona, it's now gone."
However, the newspaper Arizona Republic disagreed, reporting that "the disease is now spreading at its fastest rate here since June, just before the state became a COVID-19 epicenter this summer.
In Arizona, daily case counts, hospitalizations, percent positivity, ventilators in use and the rate at which the virus spreads have all increased in recent weeks."[77]

December[edit]
> On December 7, the Arizona State Legislature was forced to close for at least a week after lawyer Rudy Giuliani, who had tested positive for COVID-19, testified without a facemask for eleven hours about allegations of voter fraud.[78]
Sources: ADHS.
---------------------------------------------------------------------------------------------------------------------------
COVID-19 PANDEMIC IN THE UNITED STATES
| County[a] | Cases[b] | Hospitalized | Deaths | Population[c] | Cases / 100k | Deaths / 100k | Number of PCR Tests[d] | Number of Serology Tests[e] | |
|---|---|---|---|---|---|---|---|---|---|
| 15 / 15 | 378,157 | 28,525 | 6,973 | 7,189,020 | 5,260.2 | 97.00 | 2,408,041 | 372,457 | |
| Apache | 5,952 | 516 | 200 | 71,808 | 8,288.8 | 278.52 | 20,220 | 790 | |
| Cochise | 4,663 | 331 | 91 | 130,808 | 3,564.8 | 69.57 | 30,789 | 4,130 | |
| Coconino | 8,494 | 719 | 182 | 147,275 | 5,767.4 | 123.58 | 58,511 | 4,472 | |
| Gila | 3,365 | 354 | 105 | 55,159 | 6,100.5 | 190.36 | 19,340 | 4,085 | |
| Graham | 2,419 | 167 | 38 | 38,476 | 6,287.0 | 98.76 | 6,959 | 865 | |
| Greenlee | 297 | 15 | 3 | 10,375 | 2,862.7 | 28.92 | 1,619 | 160 | |
| La Paz | 996 | 79 | 21 | 22,085 | 4,509.8 | 95.09 | 5,278 | 1,394 | |
| Maricopa | 236,818 | 17,592 | 4,161 | 4,367,835 | 5,421.9 | 95.26 | 1,421,158 | 254,221 | |
| Mohave | 7,621 | 734 | 272 | 216,985 | 3,512.2 | 125.35 | 49,211 | 6,895 | |
| Navajo | 9,056 | 968 | 278 | 112,825 | 8,026.6 | 246.40 | 34,816 | 2,868 | |
| Pima | 46,849 | 3,094 | 730 | 1,044,675 | 4,484.6 | 69.88 | 360,676 | 41,867 | |
| Pinal | 19,579 | 1,678 | 276 | 455,210 | 4,301.1 | 60.63 | 143,289 | 24,975 | |
| Santa Cruz | 4,569 | 309 | 76 | 53,161 | 8,594.6 | 142.96 | 19,642 | 1,419 | |
| Yavapai | 6,989 | 569 | 130 | 232,386 | 3,007.5 | 55.94 | 60,204 | 8,883 | |
| Yuma | 20,490 | 1,400 | 410 | 229,957 | 8,910.4 | 178.29 | 90,051 | 8,321 | |
| As of December 8, 2020 Data is publicly reported by Arizona Department Of Health | |||||||||
MARICOPA COUNTY


No comments:
Post a Comment