NASA, EPA tackle NO₂ air pollution in overburdened communities

For the first time, NASA data about nitrogen dioxide (NO2), a harmful air pollutant, is available on the Environmental Protection Agency's (EPA) widely used Environmental Justice Screening and Mapping Tool (EJScreen). This update marks a crucial step in addressing air quality disparities in overburdened communities across the United States.
"Having access to this accurate and localized NO2 data allows organizations like ours to understand the air quality challenges we encounter, and to advocate more effectively for the health and well-being of community residents," said Samuel Jordan, president of the Baltimore Transit Equity Coalition.
Previously, EJScreen included data on ozone, fine particulate matter, and various other environmental hazards. But it lacked information on NO2, which has been linked to respiratory issues such as asthma, especially in children.

"Incorporating NO2 data into EJScreen is a testament to how NASA's Earth science capabilities can be applied to address crucial societal challenges," said John Haynes, NASA's program manager for Health and Air Quality. "This collaboration with the EPA underscores our commitment to using space-based observations to benefit public health and environmental justice."
- NO2 is emitted by burning fossil fuels and contributes to the formation of surface ozone. Communities of color and lower-income populations often live closer to highways, factories, transportation hubs, and other NO2 sources than their wealthier counterparts.
For example, a new study used satellite data and other information to show that nearly 150,000 warehouses in the U.S. increase local NO2 levels and are predominantly located in marginalized communities.
The findings reveal a 20% increase, on average, in near-warehouse NO2, linked to truck traffic and warehouse density.
"NO2 is very short-lived in the air, and so its levels are high in the area where it is emitted," said Gaige Kerr, study co-author and an air pollution researcher at George Washington University in Washington, who was involved in incorporating NASA's NO2 data into EJScreen.
"This tool democratizes access to high-quality NO2 data, allowing individuals without a background in data analysis or data visualization to access and understand the information easily."
"This tool democratizes access to high-quality NO2 data, allowing individuals without a background in data analysis or data visualization to access and understand the information easily."
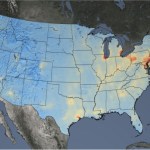
- EJScreen uses data from the Ozone Monitoring Instrument (OMI) on NASA's Aura satellite and computer models to provide average annual NO2 estimates at the census block level, revealing the amount of chronic surface-level NO2 that people may be exposed to in their neighborhoods.
The dataset was developed with contributions from George Washington University, the University of Washington School of Medicine in Seattle, and Oregon State University in Corvallis.
Their research offers crucial Earth-observation data that can guide air quality standards, shape public policies, and inform government regulations, ultimately aiming to enhance economic and human welfare.
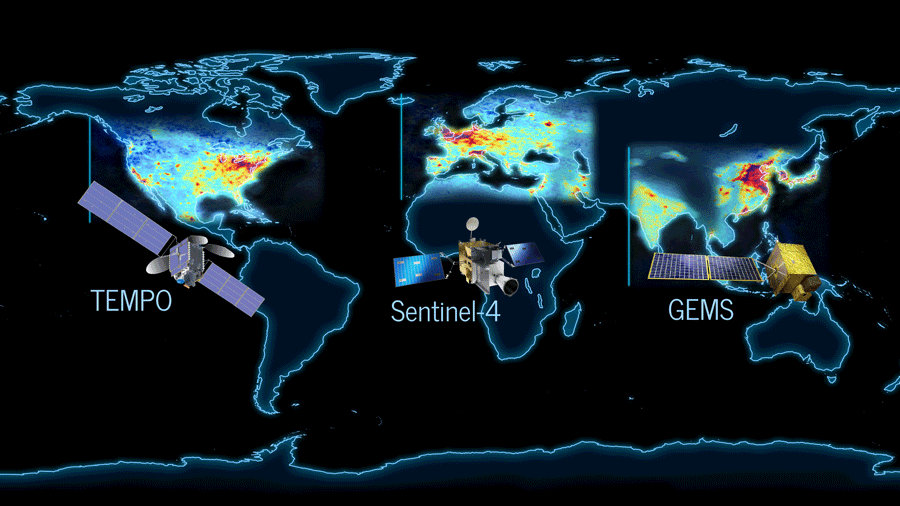
TEMPO launched in 2023 and offers hourly daytime measurements, rather than OMI's once-daily measurements. This capability could further enhance the EPA tool, providing insight on pollution levels throughout the day and supporting proactive air pollution management.
Provided by NASA's Goddard Space Flight Center

NASA Releases New High-Quality, Near Real-Time Air Quality Data
Earth Science Public Affairs Officer, NASA Langley Research Center
May 30, 2024
NASA has made new data available that can provide air pollution observations at unprecedented resolutions – down to the scale of individual neighborhoods.
“TEMPO is one of NASA’s Earth observing instruments making giant leaps to improve life on our home planet,” said NASA Administrator Bill Nelson.
NASA has made new data available that can provide air pollution observations at unprecedented resolutions – down to the scale of individual neighborhoods.
The near real-time data comes from the agency’s TEMPO (Tropospheric Emissions: Monitoring of Pollution) instrument, which launched last year to improve life on Earth by revolutionizing the way scientists observe air quality from space.
- This new data is available from the Atmospheric Science Data Center at NASA’s Langley Research Center in Hampton, Virginia.
“NASA and the Biden-Harris Administration are committed to addressing the climate crisis and making climate data more open and available to all. The air we breathe affects everyone, and this new data is revolutionizing the way we track air quality for the benefit of humanity.”
Play Video
Play Video
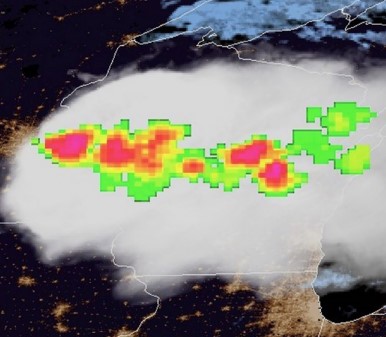
The TEMPO instrument measured elevated levels of nitrogen dioxide (NO2) from a number of different areas and emission sources throughout the daytime on March 28, 2024. Yellow, red, purple, and black clusters represent increased levels of pollutants from TEMPO’s data and show drift over time.
Credit: Trent Schindler/NASA’s Scientific Visualization Studio
Credit: Trent Schindler/NASA’s Scientific Visualization Studio
The TEMPO mission gathers hourly daytime scans of the atmosphere over North America from the Atlantic Ocean to the Pacific Coast, and from Mexico City to central Canada. The instrument detects pollution by observing how sunlight is absorbed and scattered by gases and particles in the troposphere, the lowest layer of Earth’s atmosphere.
Play Video
We have more than 500 early adopters that will be using these datasets right away.
hazem mahmoud
NASA Data Scientist
“Data gathered by TEMPO will play an important role in the scientific analysis of pollution,” said Xiong Liu, senior physicist at the Smithsonian Astrophysical Observatory and principal investigator for the mission. “For example, we will be able to conduct studies of rush hour pollution, linkages of diseases and health issues to acute exposure of air pollution, how air pollution disproportionately impacts underserved communities, the potential for improved air quality alerts, the effects of lightning on ozone, and the movement of pollution from forest fires and volcanoes.”
Measurements by TEMPO include air pollutants such as nitrogen dioxide, formaldehyde, and total column ozone.
Play Video
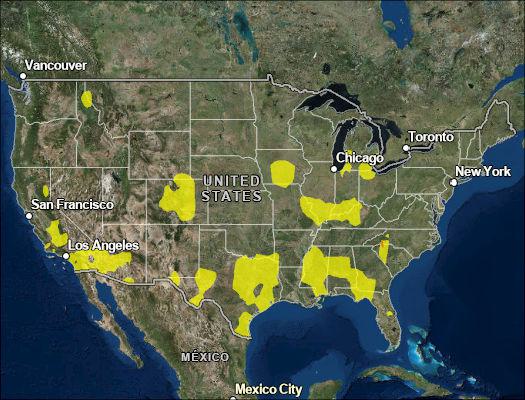
High NO2 levels associated with prescribed burns are seen popping up across East Texas, Oklahoma, Louisiana, Arkansas, and Mississippi, beginning around 1:00 p.m. and extending into the evening. Elevated NO2 levels are visible in cities from El Paso to Memphis.
Credit: Trent Schindler/NASA’s Scientific Visualization Studio
“Poor air quality exacerbates pre-existing health issues, which leads to more hospitalizations,” said Jesse Bell, executive director at the University of Nebraska Medical Center’s Water, Climate, and Health Program. Bell is an early adopter of TEMPO’s data.
Bell noted that there is a lack of air quality data in rural areas since monitoring stations are often hundreds of miles apart. There is also an observable disparity in air quality from neighborhood to neighborhood.
“Low-income communities, on average, have poorer air quality than more affluent communities,” said Bell. “For example, we’ve conducted studies and found that in Douglas County, which surrounds Omaha, the eastern side of the county has higher rates of pediatric asthma hospitalizations. When we identify what populations are going to the hospital at a higher rate than others, it’s communities of color and people with indicators of poverty. Data gathered by TEMPO is going to be incredibly important because you can get better spatial and temporal resolution of air quality across places like Douglas County.”
Determining sources of air pollution can be difficult as smoke from wildfires or pollutants from industry and traffic congestion drift on winds. The TEMPO instrument will make it easier to trace the origin of some pollutants.
Play Video
TEMPO observes the northerly transport of NO2 from the Permian basin, a large oil and natural gas producing area spanning parts of West Texas and southeastern New Mexico, with the highest levels measured during the morning over the basin. NO2 plumes from coal-fired power plants are visible in the rural areas far west and northwest of Houston and far east of Dallas between 8:00 a.m. and 2:00 p.m.
Credit: Trent Schindler/NASA’s Scientific Visualization Studio
“The National Park Service is using TEMPO data to gain new insight into emerging air quality issues at parks in southeast New Mexico,” explained National Park Service chemist, Barkley Sive. “Oil and gas emissions from the Permian Basin have affected air quality at Carlsbad Caverns and other parks and their surrounding communities. While pollution control strategies have successfully decreased ozone levels across most of the United States, the data helps us understand degrading air quality in the region.”
The TEMPO instrument was built by BAE Systems, Inc., Space & Mission Systems (formerly Ball Aerospace) and flies aboard the Intelsat 40e satellite built by Maxar Technologies. The TEMPO Ground System, including the Instrument Operations Center and the Science Data Processing Center, are operated by the Smithsonian Astrophysical Observatory, part of the Center for Astrophysics | Harvard & Smithsonian.
Read More
To learn more about TEMPO visit: https://nasa.gov/tempo
@NASA@nasalarc
@NASA@NASA_Langley
@NASA@NASA_Langley
@NASA@company/nasa-langley-research-center
- “All the pollutants that TEMPO is measuring cause health issues,” said Hazem Mahmoud, science lead at NASA Langley’s Atmospheric Science Data Center.
- “We have more than 500 early adopters using these datasets right away.
- We expect to see epidemiologists and health experts using this data in the near future.
Play Video
NO2 levels are elevated along major traffic corridors including I-35 in Texas with the highest levels between 9:00 a.m. and 12:00 p.m. Elevated NO2 levels are shown across cities including Houston, Dallas, and San Antonio, with the highest levels persisting across Houston from morning to evening.
Credit: Trent Schindler/NASA’s Scientific Visualization Studio
An early adopter program has allowed policymakers and other air quality stakeholders to understand the capabilities and benefits of TEMPO’s measurements. Since October 2023, the TEMPO calibration and validation team has been working to evaluate and improve TEMPO data products.

We have more than 500 early adopters that will be using these datasets right away.
hazem mahmoud
NASA Data Scientist
“Data gathered by TEMPO will play an important role in the scientific analysis of pollution,” said Xiong Liu, senior physicist at the Smithsonian Astrophysical Observatory and principal investigator for the mission. “For example, we will be able to conduct studies of rush hour pollution, linkages of diseases and health issues to acute exposure of air pollution, how air pollution disproportionately impacts underserved communities, the potential for improved air quality alerts, the effects of lightning on ozone, and the movement of pollution from forest fires and volcanoes.”
Measurements by TEMPO include air pollutants such as nitrogen dioxide, formaldehyde, and total column ozone.
Play Video
High NO2 levels associated with prescribed burns are seen popping up across East Texas, Oklahoma, Louisiana, Arkansas, and Mississippi, beginning around 1:00 p.m. and extending into the evening. Elevated NO2 levels are visible in cities from El Paso to Memphis.
Credit: Trent Schindler/NASA’s Scientific Visualization Studio
“Poor air quality exacerbates pre-existing health issues, which leads to more hospitalizations,” said Jesse Bell, executive director at the University of Nebraska Medical Center’s Water, Climate, and Health Program. Bell is an early adopter of TEMPO’s data.
Bell noted that there is a lack of air quality data in rural areas since monitoring stations are often hundreds of miles apart. There is also an observable disparity in air quality from neighborhood to neighborhood.
“Low-income communities, on average, have poorer air quality than more affluent communities,” said Bell. “For example, we’ve conducted studies and found that in Douglas County, which surrounds Omaha, the eastern side of the county has higher rates of pediatric asthma hospitalizations. When we identify what populations are going to the hospital at a higher rate than others, it’s communities of color and people with indicators of poverty. Data gathered by TEMPO is going to be incredibly important because you can get better spatial and temporal resolution of air quality across places like Douglas County.”
Determining sources of air pollution can be difficult as smoke from wildfires or pollutants from industry and traffic congestion drift on winds. The TEMPO instrument will make it easier to trace the origin of some pollutants.
Play Video
TEMPO observes the northerly transport of NO2 from the Permian basin, a large oil and natural gas producing area spanning parts of West Texas and southeastern New Mexico, with the highest levels measured during the morning over the basin. NO2 plumes from coal-fired power plants are visible in the rural areas far west and northwest of Houston and far east of Dallas between 8:00 a.m. and 2:00 p.m.
Credit: Trent Schindler/NASA’s Scientific Visualization Studio
“The National Park Service is using TEMPO data to gain new insight into emerging air quality issues at parks in southeast New Mexico,” explained National Park Service chemist, Barkley Sive. “Oil and gas emissions from the Permian Basin have affected air quality at Carlsbad Caverns and other parks and their surrounding communities. While pollution control strategies have successfully decreased ozone levels across most of the United States, the data helps us understand degrading air quality in the region.”
The TEMPO instrument was built by BAE Systems, Inc., Space & Mission Systems (formerly Ball Aerospace) and flies aboard the Intelsat 40e satellite built by Maxar Technologies. The TEMPO Ground System, including the Instrument Operations Center and the Science Data Processing Center, are operated by the Smithsonian Astrophysical Observatory, part of the Center for Astrophysics | Harvard & Smithsonian.
Read More
To learn more about TEMPO visit: https://nasa.gov/tempo
@NASA@nasalarc
@NASA@NASA_Langley
@NASA@NASA_Langley
@NASA@company/nasa-langley-research-center


No comments:
Post a Comment