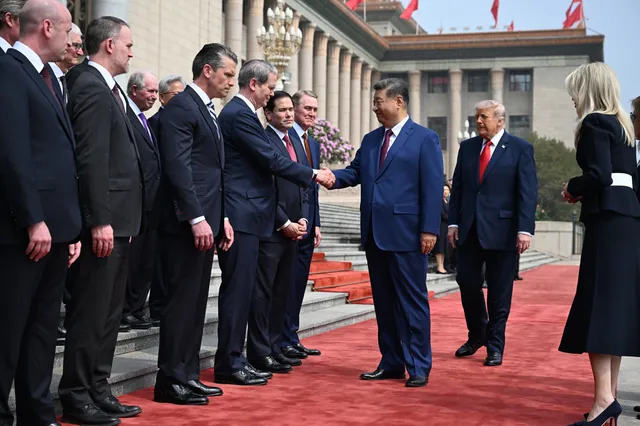
Watch: Trump-Xi Summit: Lavish Welcome, Taiwan in Focus
Xi’s Threat to Trump Cements Taiwan as Top US-China Risk


Your News


At China Summit, Trump Has CEOs, But Xi Has Leverage
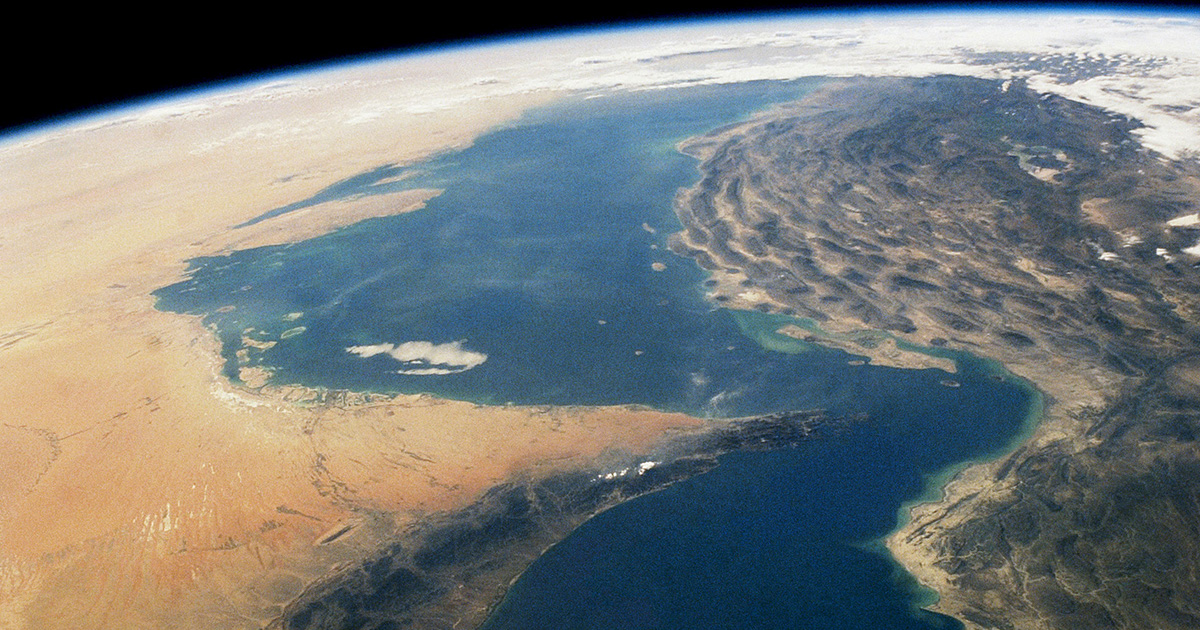
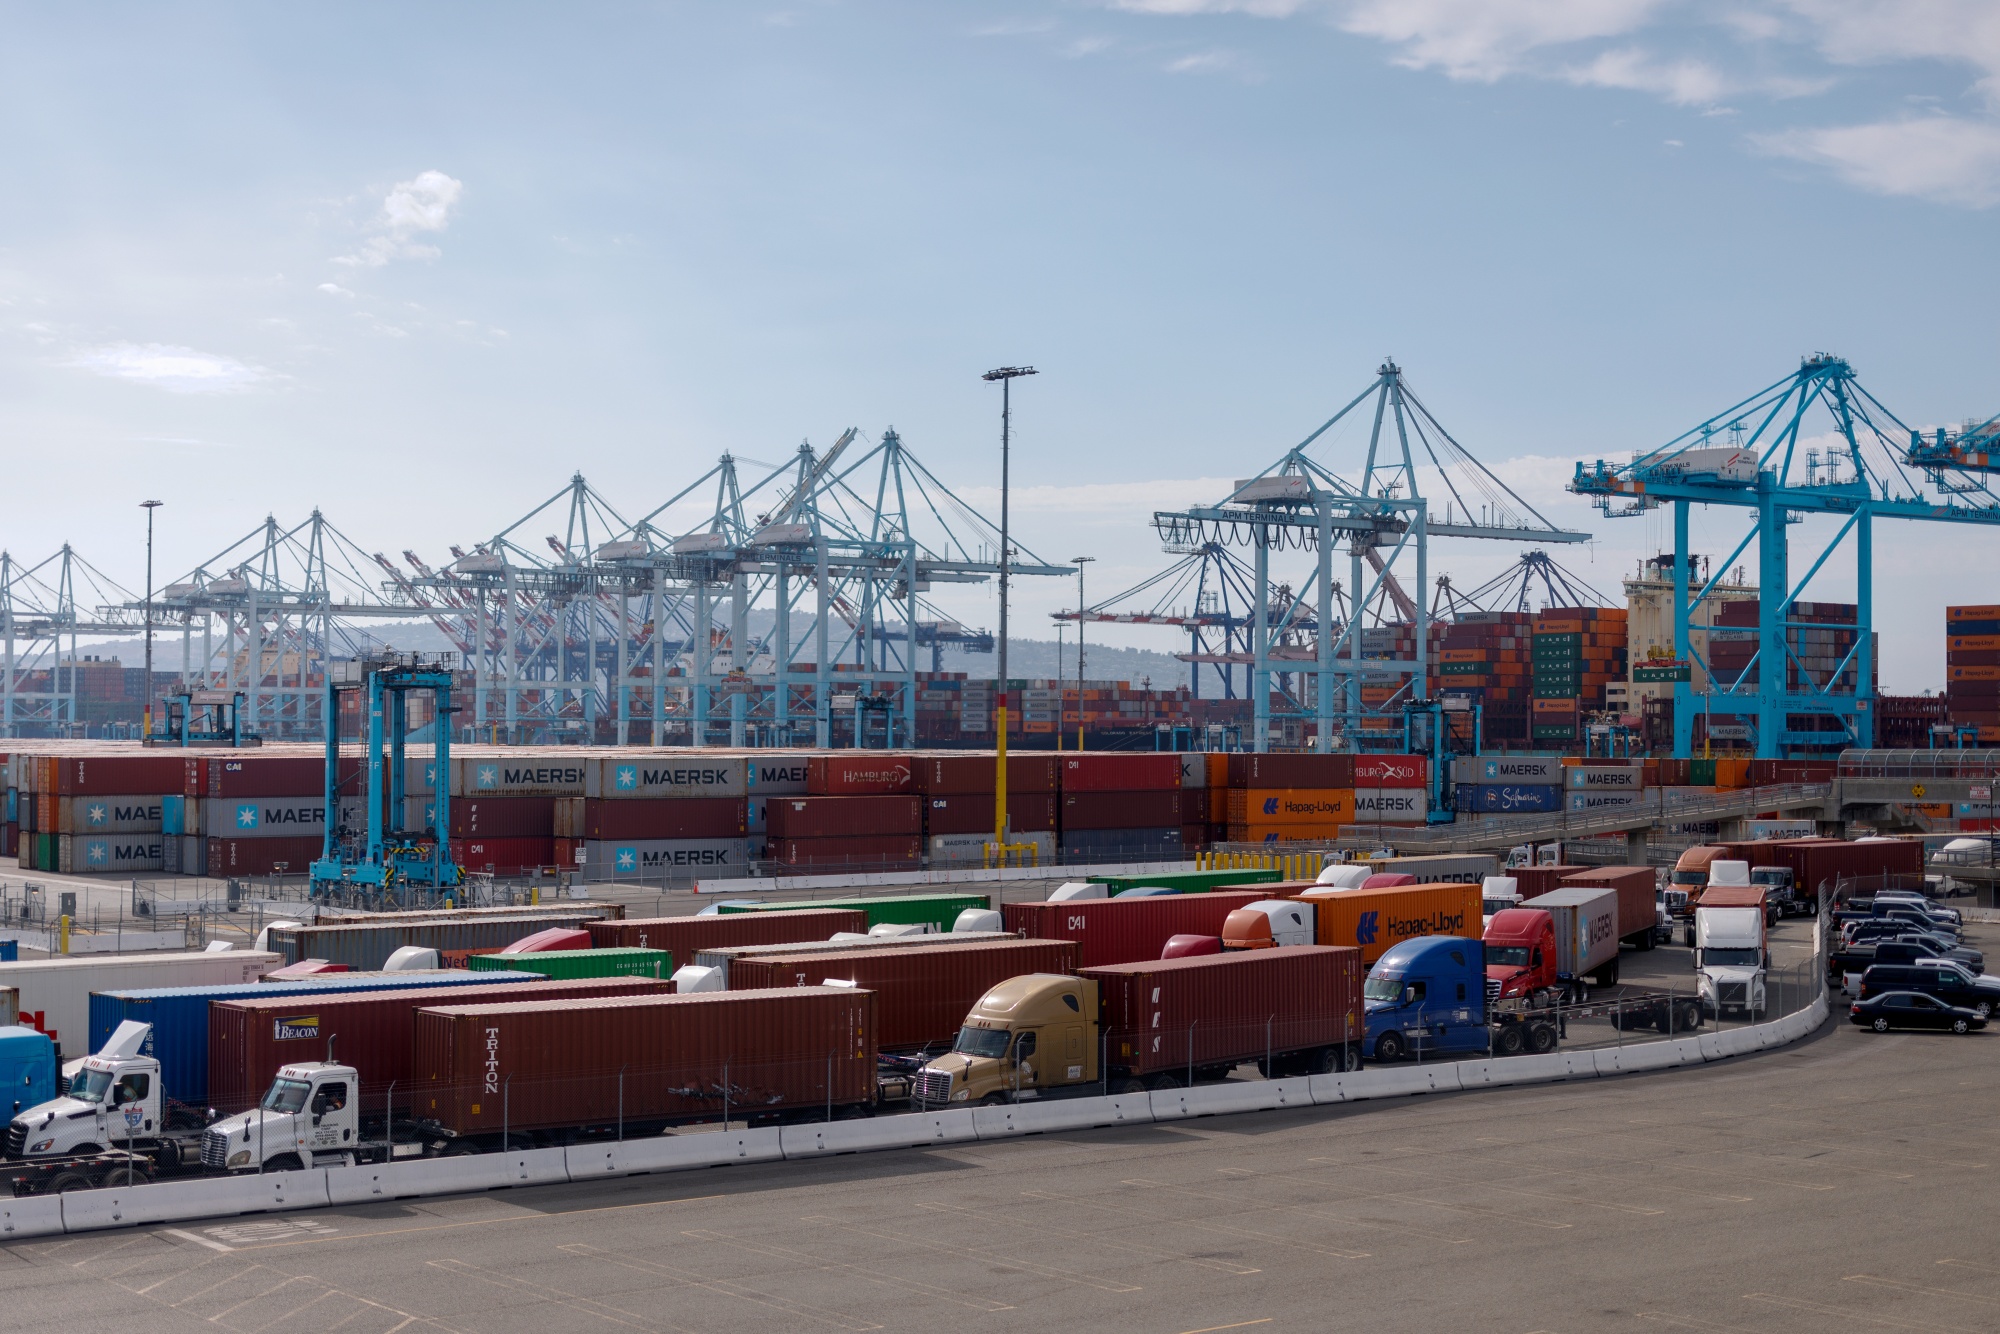
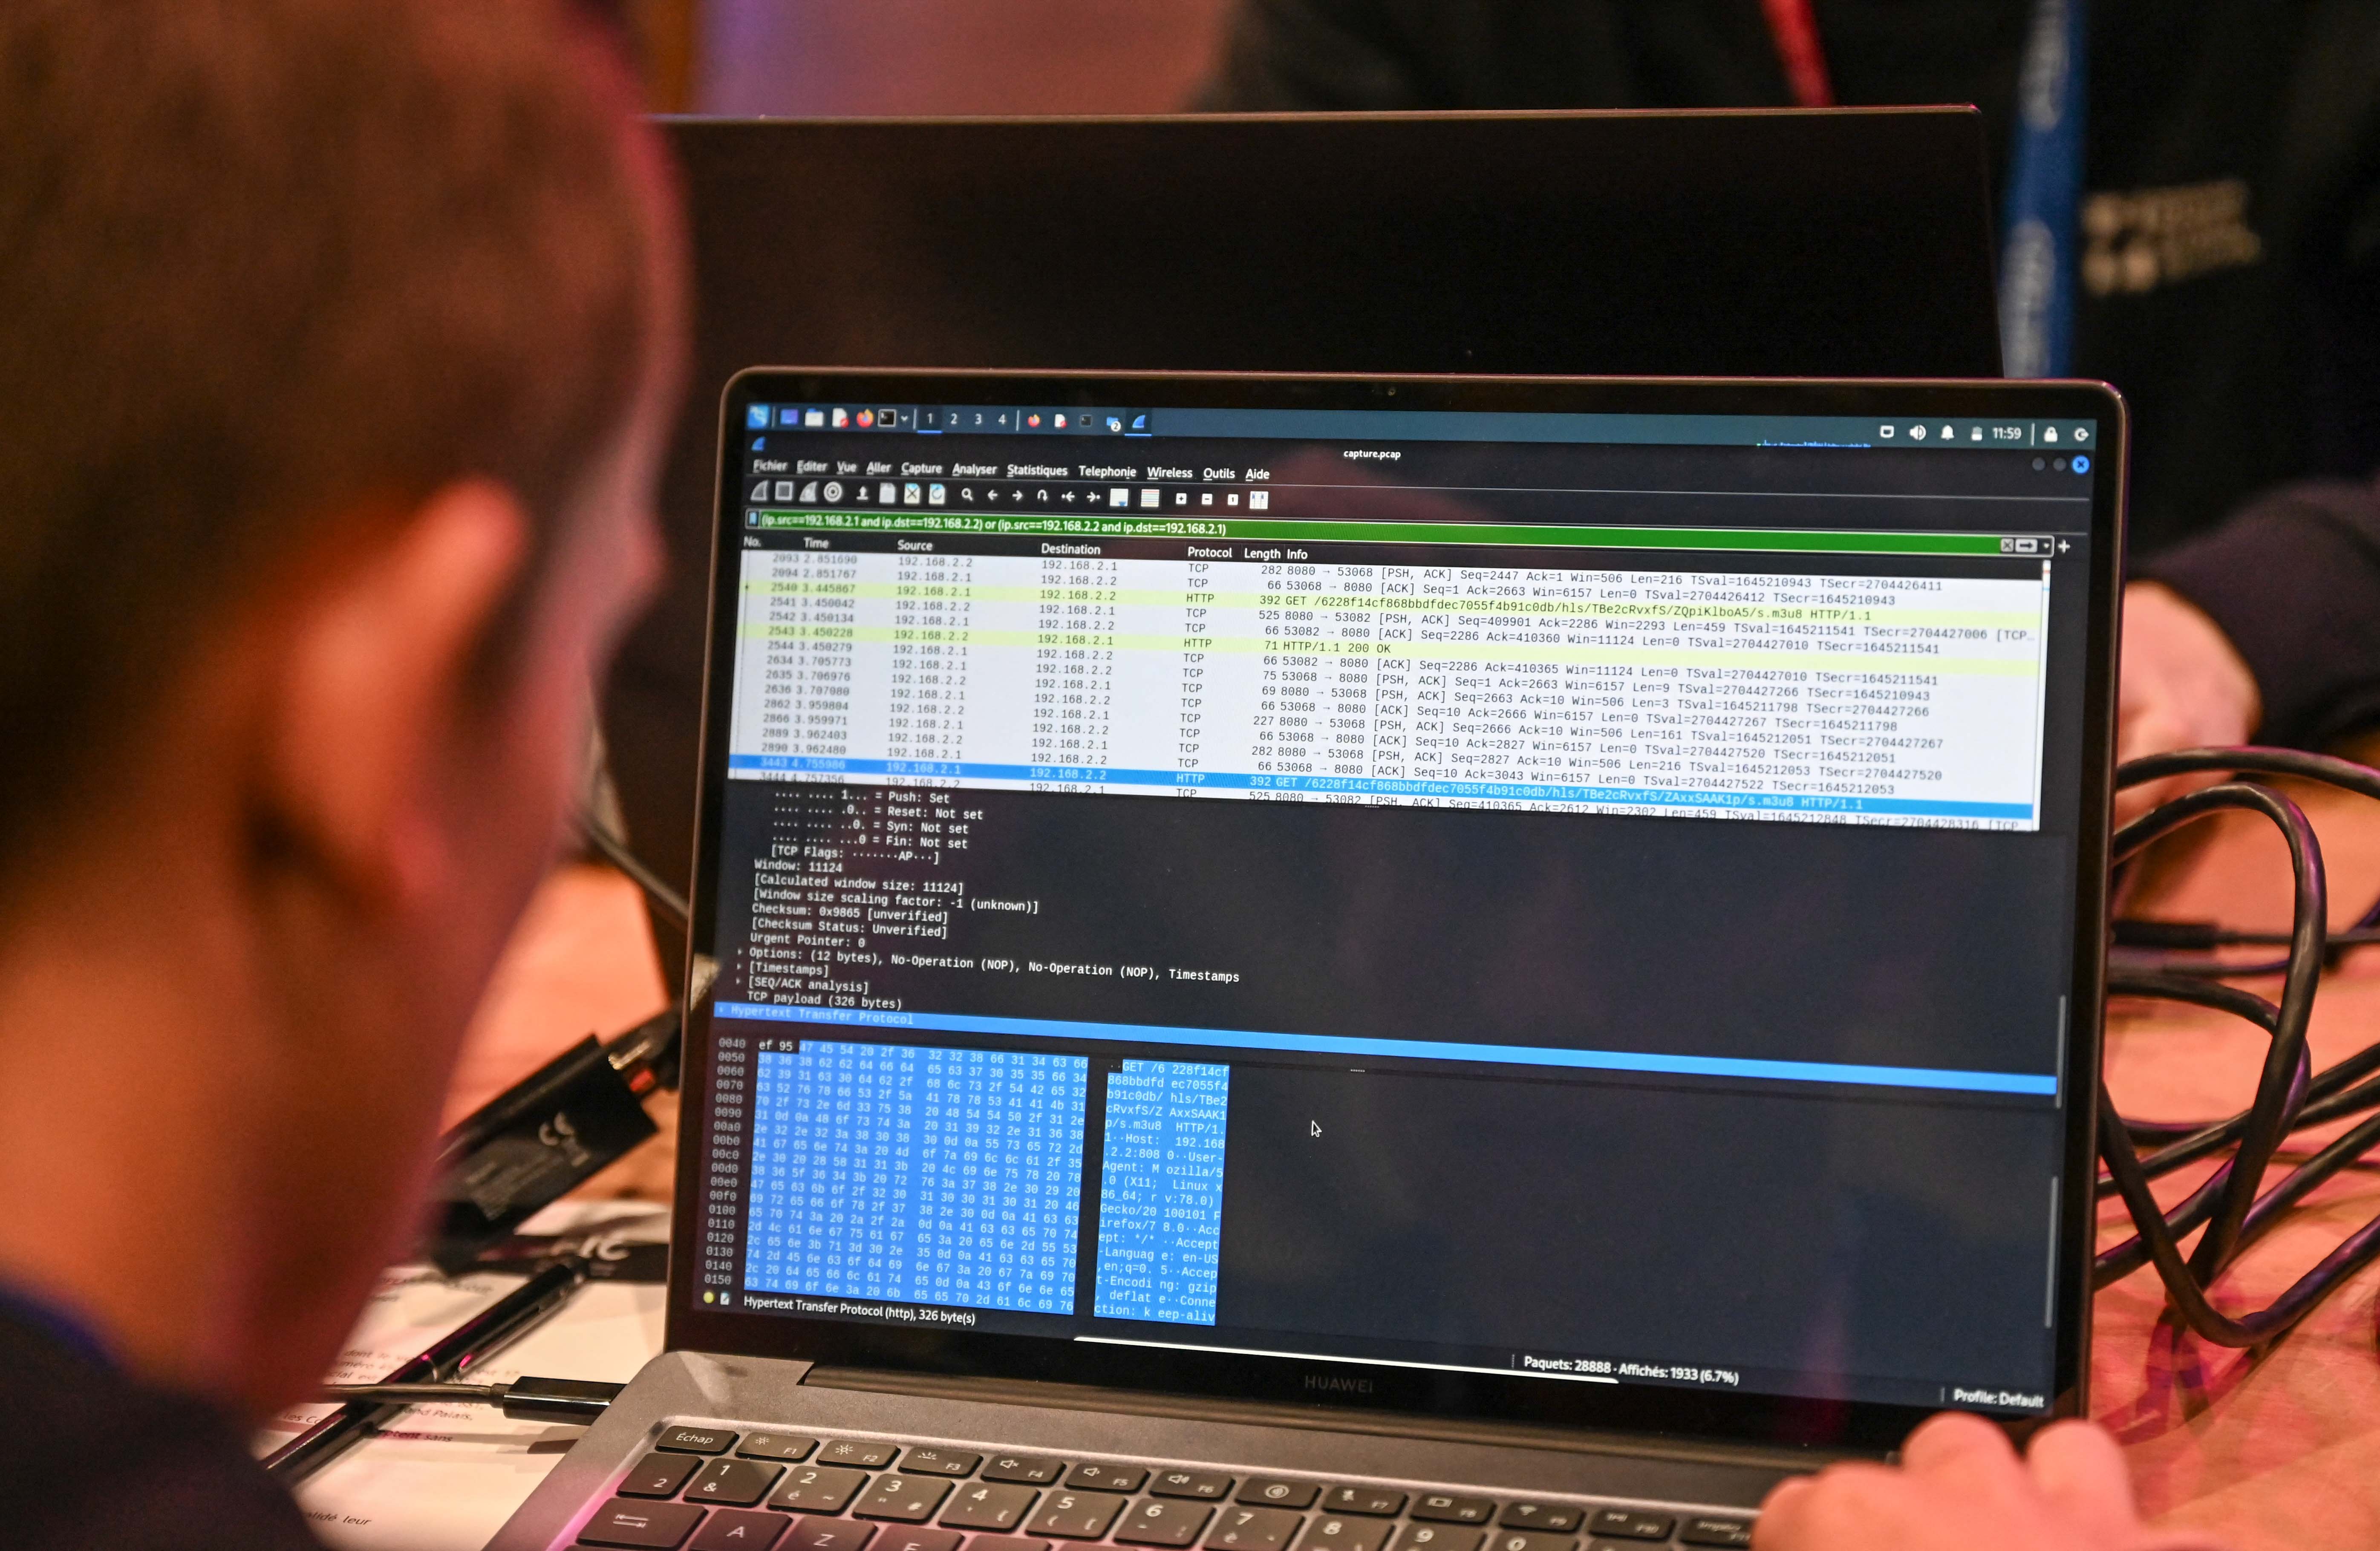
Undersea Internet Cable Projects Are Getting Tangled in the Iran War


Watch: Trump-Xi Summit: Lavish Welcome, Taiwan in Focus
|
|


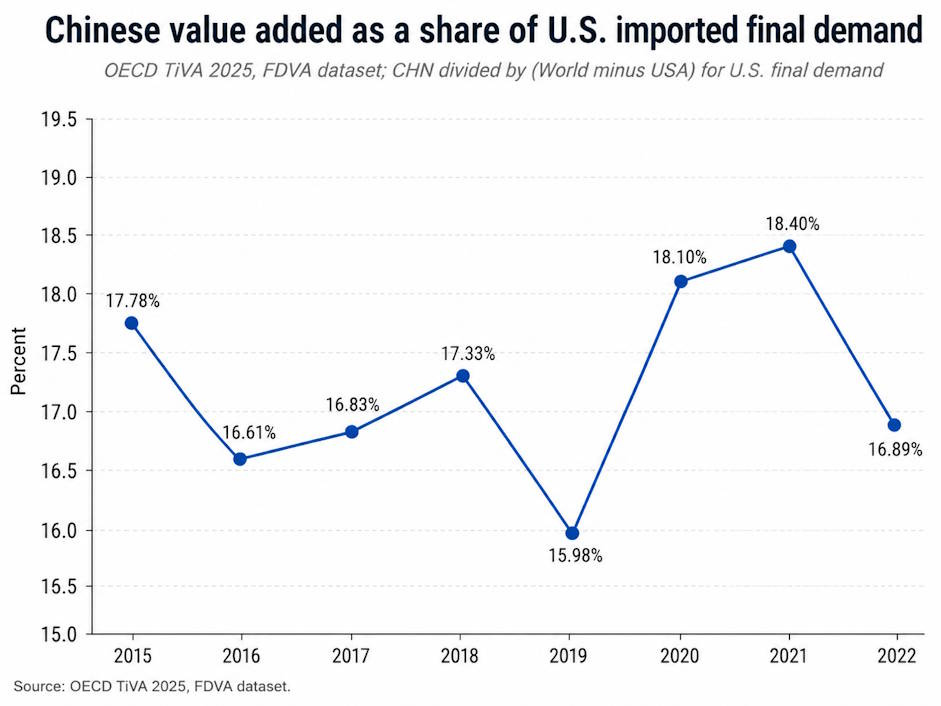
Trade in Value-Added (TiVA) indicators provide insights into:


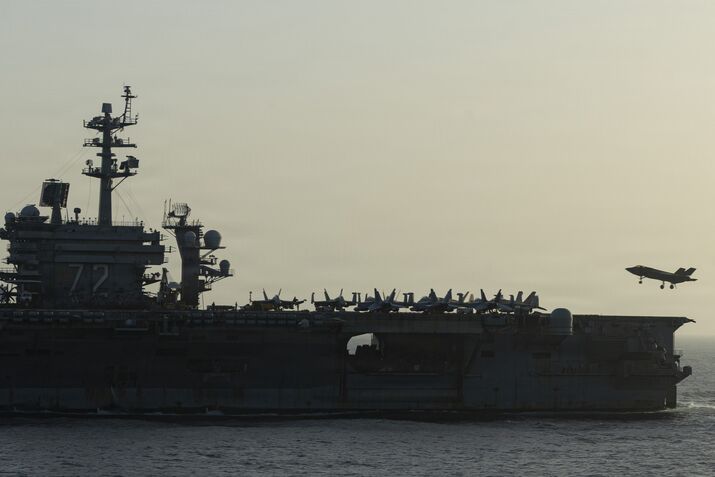
Jul 3 U.S. Navy Sends USS Boxer Amphibious Ready Group to Middle East as Regional Tensions Rise The U.S. Navy has expanded its expeditiona...