What's the unemployment rate?
The monthly unemployment rate released by the Bureau of Labor Statistics (BLS) is one of the most widely used gauges of how the job market is holding up. The BLS calculates the rate by dividing the number of unemployed people who are looking for work by the total labor force. The rate was 4.2% in June, down 0.1 percentage point from the month before.Many states had rates above the national average. California, Washington, Oregon and Connecticut had the highest unemployment rates at 5.2%. The Dakotas had the lowest rates: 2.0% in South Dakota and 2.3% in North Dakota.
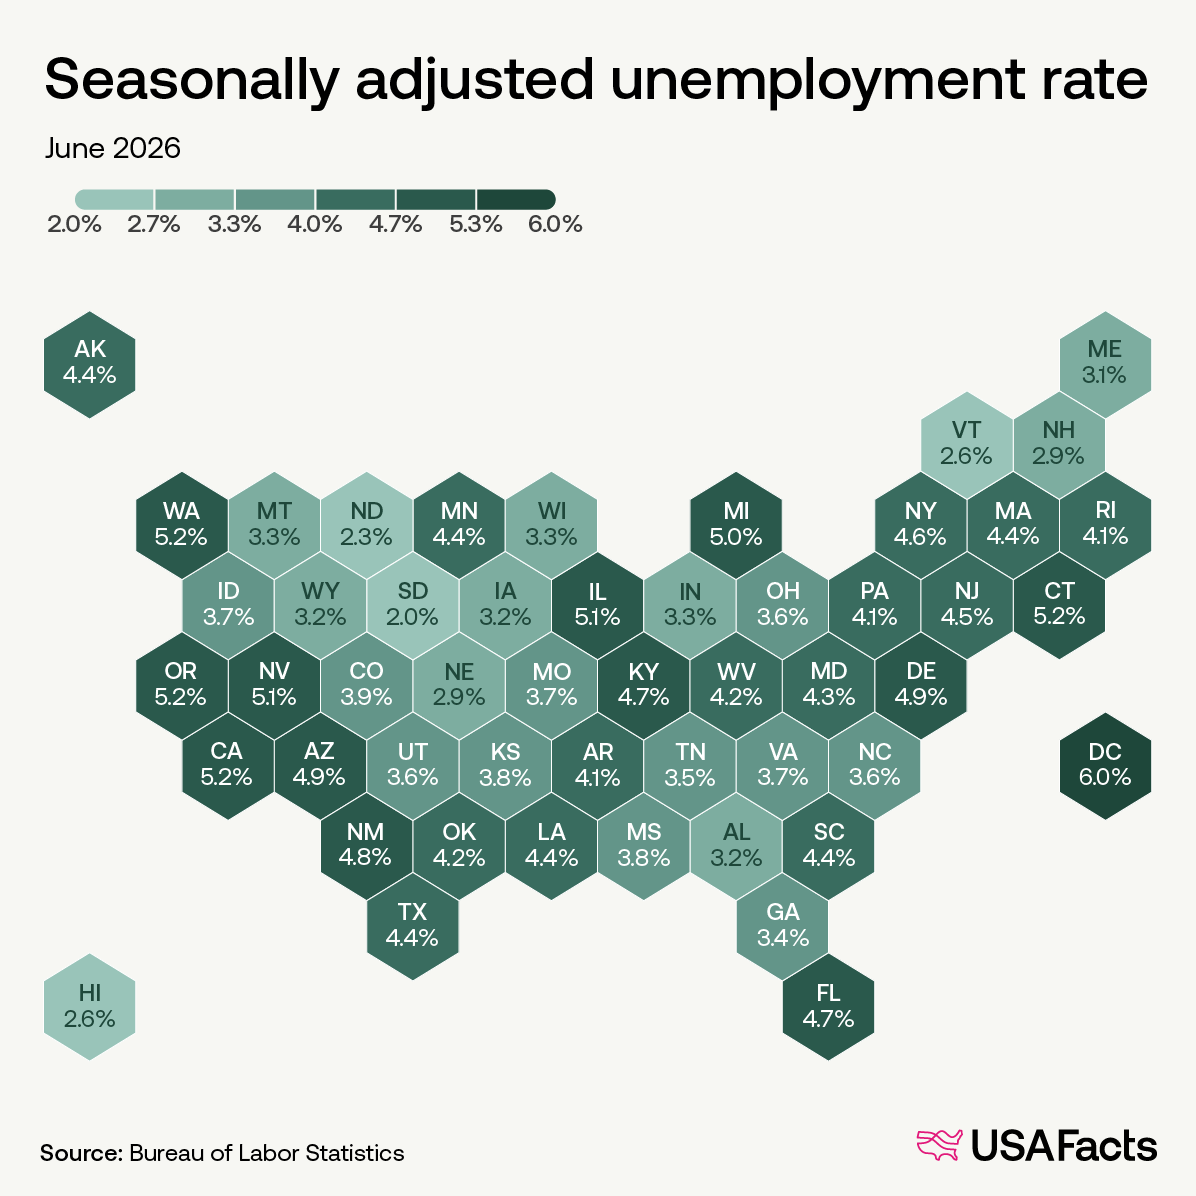
Alabama and Kentucky had the largest rate increases from May to June, rising from 3.0% to 3.2% and from 4.5% to 4.7%, respectively.
The BLS has several other measures to track unemployment, including discouraged workers who haven't sought jobs because they don't believe any are available to them. See all the measures (do you/have you ever counted yourself among them?) and explore your state’s data in the article.
See the data

“Why aren’t these facts more current?”

That’s a question we recently received from a reader. And it’s a very good one. It takes a long time for government agencies to collect and share data. That’s a little understandable given the size and scope of government programs. But, like this astute reader, we think it takes too long. You can’t plan for tomorrow with data from two years ago, but that’s often the most recent data available.
Here’s an opportunity to push for a government that runs on better information, faster. Sign your name alongside Steve Ballmer in our open letter to Congress and tell lawmakers to modernize government data collection. This is bigger than one report or one agency. This data could do so much more.
Everyday Americans, agencies, and lawmakers all have a role to play in building a smarter, more transparent government.
Add your name

Mapping homelessness across cities
Just over 50% of the nation’s homeless population lives in, or near, the country’s 50 biggest cities.This data comes from the Department of Housing and Urban Development (HUD)’s annual Point-in-Time Count, a one-night January tally of people in shelters or without shelter.
Here’s more about how the count works and what the latest data shows.
HUD divides the US into 386 continuums of care (CoC), which are groups of local nonprofits, hospitals, law enforcement, mental health providers, and many others, that coordinate homelessness services. Some cover one city, others span wide areas.
About 745,652 people were homeless in January 2025
The CoCs containing New York City and Los Angeles had the largest homeless populations, at 125,683 and 67,777 people, respectively. These are also the two most populous cities in the country.
The data is divided into whether someone is sheltered (such as in emergency shelters and transitional housing) or unsheltered. About 34.5% of LA’s homeless population was sheltered, compared with 96.3% in New York City.
Seven of the 10 major-city CoCs with the highest unsheltered rates were in California. These included, among others, Long Beach, San Jose/Santa Clara, and San Diego. Among these, the rates of homeless people without shelter ranged from 71.4% in Long Beach to 56.4% in Sacramento.
Boston, New York City, Milwaukee, Memphis, and Baltimore had the highest rates of homeless people with shelter, all above 90%. Colder-climate cities tend to have more sheltered people during the January count.
See the data
Five states ranging as far and wide as Washington to Michigan to Virginia are holding primaries on August 4. How red or blue have these states voted in the past?
Are you keeping up with the data? Take the weekly fact quiz to find out.
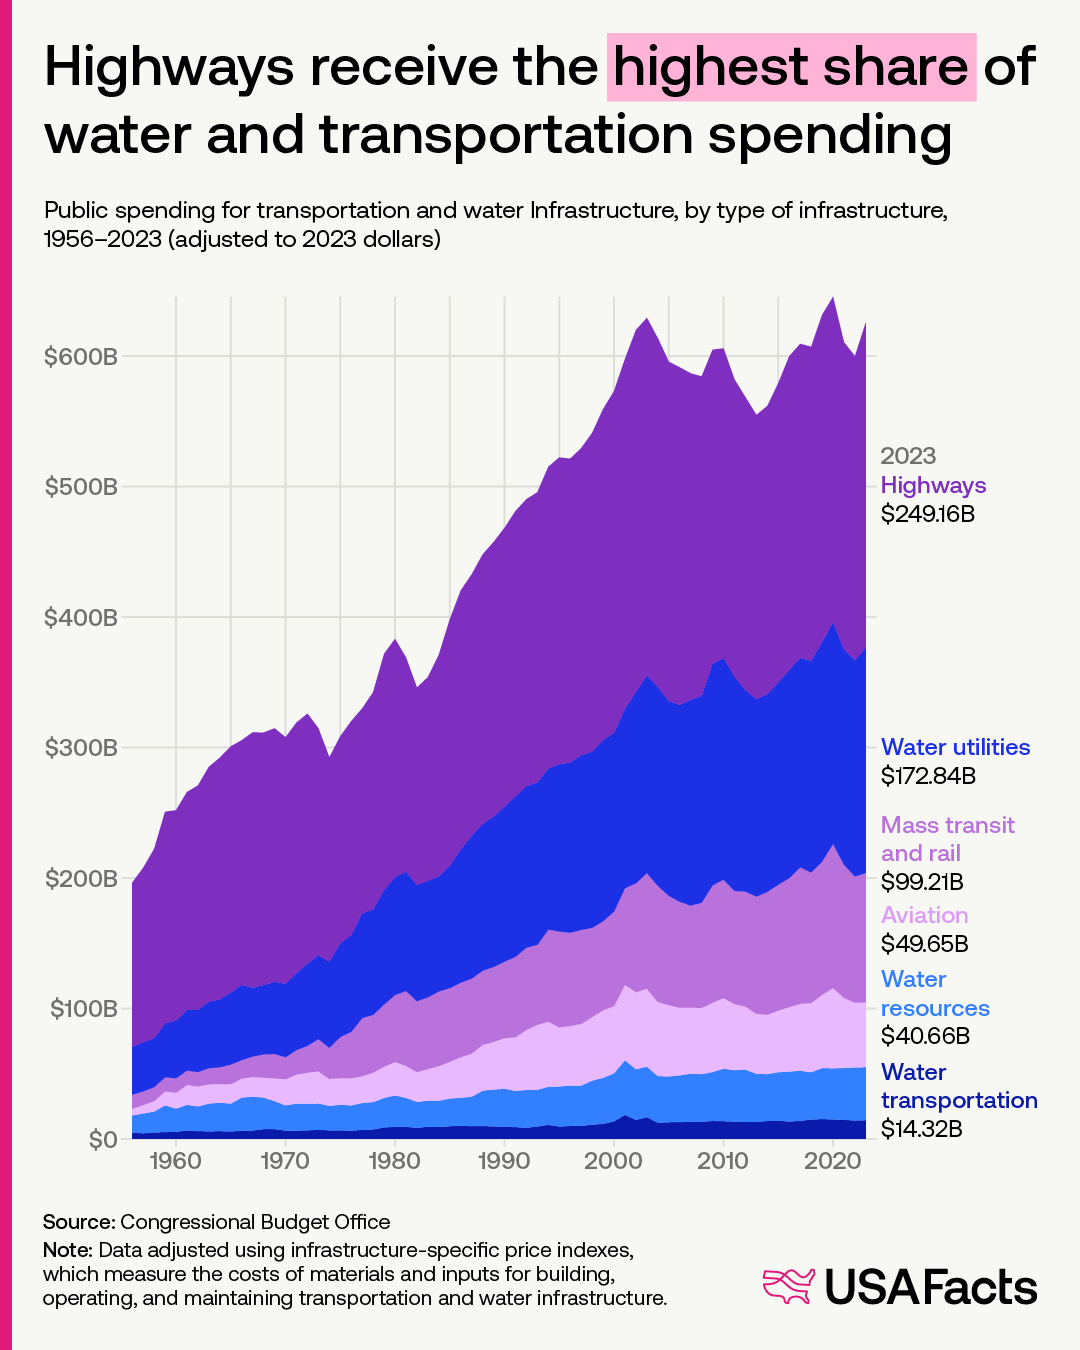
In 2023, the largest share of government transportation and water infrastructure spending was for the nation’s highways ($249.16 billion). Water utilities came in second ($172.84 billion), followed by mass transit and rail ($99.21 billion).
Why are water utilities including and transportation spending measured together? That’s because they’re both basic infrastructure subcategories and are mainly funded through the public sector. Both involve large, long-lived physical assets managed largely by governments, so they use similar methods to measure the infrastructure’s value and how it depreciates over time.

HUD divides the US into 386 continuums of care (CoC), which are groups of local nonprofits, hospitals, law enforcement, mental health providers, and many others, that coordinate homelessness services. Some cover one city, others span wide areas.
About 745,652 people were homeless in January 2025
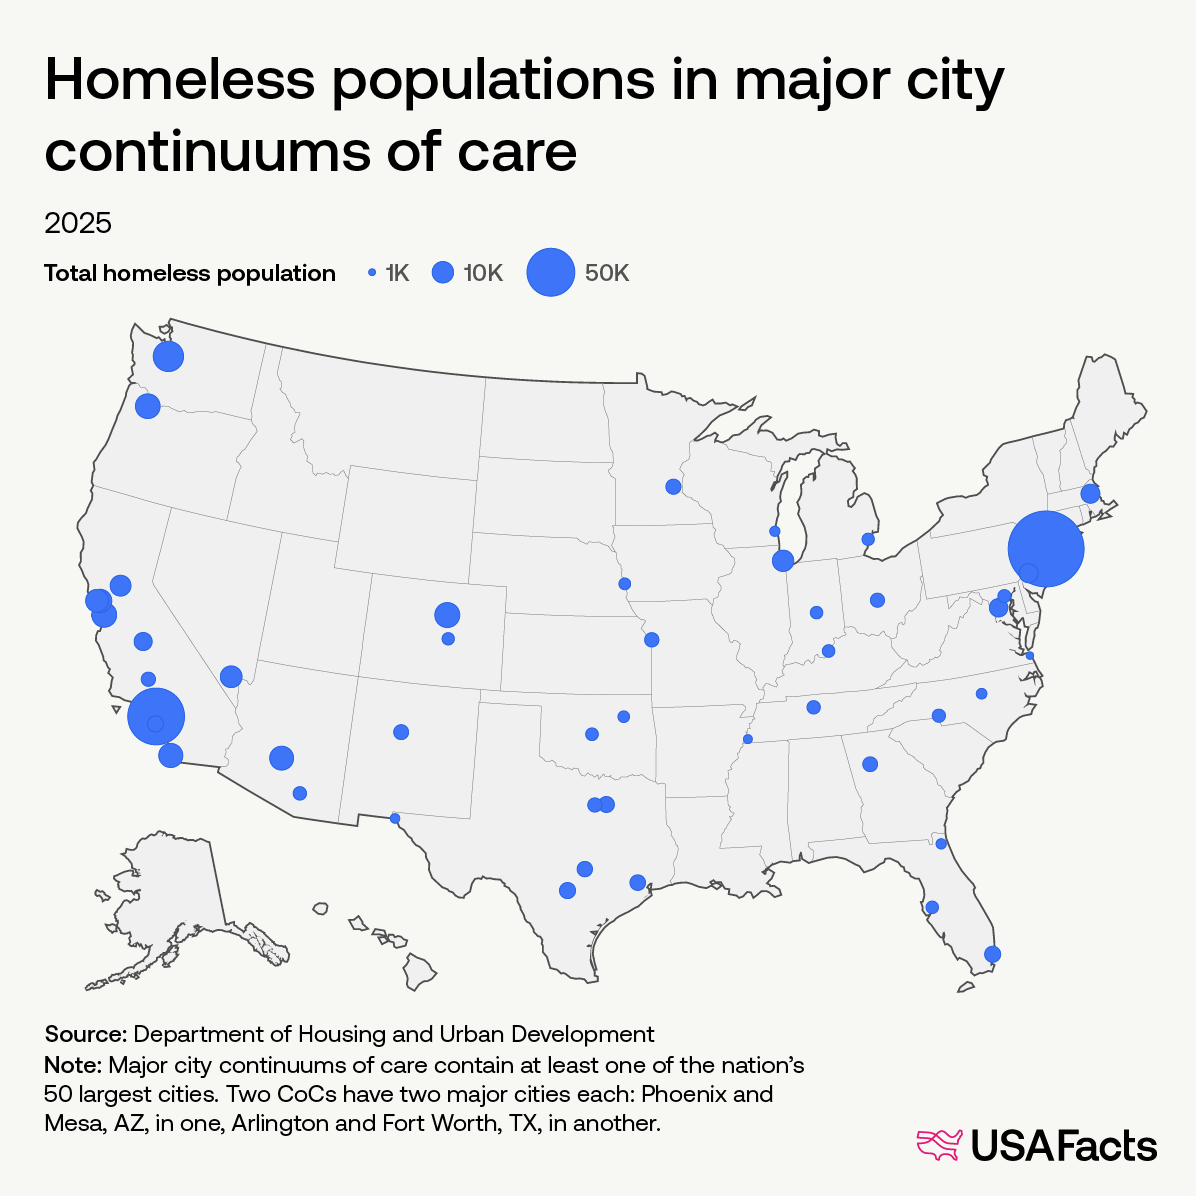 |
The CoCs containing New York City and Los Angeles had the largest homeless populations, at 125,683 and 67,777 people, respectively. These are also the two most populous cities in the country.
The data is divided into whether someone is sheltered (such as in emergency shelters and transitional housing) or unsheltered. About 34.5% of LA’s homeless population was sheltered, compared with 96.3% in New York City.
Seven of the 10 major-city CoCs with the highest unsheltered rates were in California. These included, among others, Long Beach, San Jose/Santa Clara, and San Diego. Among these, the rates of homeless people without shelter ranged from 71.4% in Long Beach to 56.4% in Sacramento.
Boston, New York City, Milwaukee, Memphis, and Baltimore had the highest rates of homeless people with shelter, all above 90%. Colder-climate cities tend to have more sheltered people during the January count.
See the data
Data behind the news
The Federal Reserve voted to leave interest rates in a range between 3.5% and 3.75% last week. Learn more about the Fed in this video with Steve Ballmer.Five states ranging as far and wide as Washington to Michigan to Virginia are holding primaries on August 4. How red or blue have these states voted in the past?
Are you keeping up with the data? Take the weekly fact quiz to find out.
One last fact
In 2023, the largest share of government transportation and water infrastructure spending was for the nation’s highways ($249.16 billion). Water utilities came in second ($172.84 billion), followed by mass transit and rail ($99.21 billion).
Why are water utilities including and transportation spending measured together? That’s because they’re both basic infrastructure subcategories and are mainly funded through the public sector. Both involve large, long-lived physical assets managed largely by governments, so they use similar methods to measure the infrastructure’s value and how it depreciates over time.


No comments:
Post a Comment