The Maricopa County Air Quality Department ensures that clean air standards are achieved and maintained for the people of Maricopa County.
"By
Sunday, skies will clear as we continue to heat up. Temperatures
reaching the 90s, along with winds that will struggle to disperse any
pollutants out of the valley. Due to these expected conditions, ozone is
forecasted to increase into the mid-Moderate AQI by Sunday.
On
Monday, these weather conditions will persist. Due to more local
activity, more commuters, and more industry potentially emitting higher
levels of ozone precursors, ozone may even reach the upper-Moderate AQI.
Watching ozone trends over the weekend will give us a good indication
on how close we are to reaching the first USG AQI day for ozone here in
Phoenix, as the exceedance season is just around the corner. . .
Ozone will be the parameter
to watch, with levels expected to increase
Reliable Sources
TODAY'S AIR QUALITY INDEX + WEEKEND FORECAST

WHAT'S THIS????????????
Data for Maricopa County NOT INCLUDED - Missing!
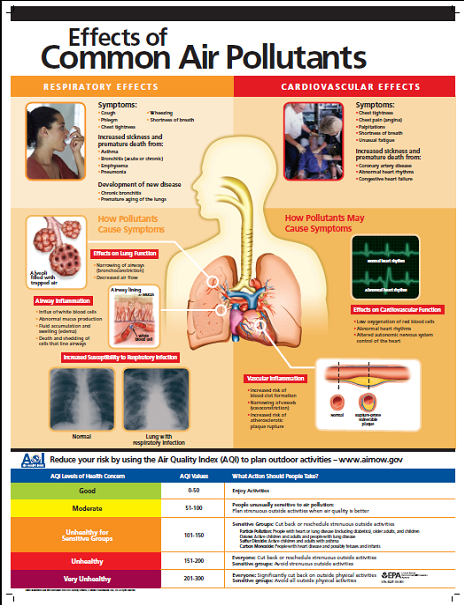
“The Air Quality Index tells you how clean or polluted your outdoor air is, along with associated health effects that may be of concern,” EPA spokesperson Melissa Sullivan said in an email. “Millions of people live in areas where air pollution can cause serious health problems.”
Overall, Arizona had the worst air quality of any state in the Intermountain West with the average of unhealthy days per year reaching nearly 20, double that of second place Utah.
Is air quality in the West getting better or worse? - Deseret News
". . .The federal Environmental Protection Agency said concentrations of air pollutants have dropped “significantly” since 1990. And over the past decade in the Intermountain West, days rated as variants of “unhealthy” in the EPA’s Air Quality Index dropped to new lows in 2019, a Deseret News analysis found.
The Deseret News arrived at statewide numbers by adding together days designated as “unhealthy for sensitive groups,” “unhealthy” and “very unhealthy” in each county, then averaging those totals within each state. The average number of total unhealthy days across Arizona, Colorado, Idaho, New Mexico, Nevada, Utah and Wyoming in 2020 was less than it was in 2010.
“The Air Quality Index tells you how clean or polluted your outdoor air is, along with associated health effects that may be of concern,” EPA spokesperson Melissa Sullivan said in an email. “Millions of people live in areas where air pollution can cause serious health problems.”
Overall, Arizona had the worst air quality of any state in the Intermountain West with the average of unhealthy days per year reaching nearly 20, double that of second place Utah.
And that ranking comes without data from Maricopa County, Arizona’s most populated area, which was excluded from the past decade’s data because the EPA said the results “are not reliable” due to “anomalous, elevated ozone concentrations from one monitor.”
“We are working with the reporting agency to resolve the issue,” Sullivan said.
Although air quality data goes through a quality assurance procedure, it isn’t always reliable because of delays in reporting, state data gathering and reporting methods, faulty monitors or other anomalies.
“Like all tools, the AQI is only as good as the data used to drive it,” Sullivan said. “It is the best tool available to communicate air quality levels to the general public and has been used for over 20 years. Because of its reliability it has been adopted and imitated worldwide.”
✓ Regarding methods varying by state, some do not consistently report data for all counties and might not track all pollutants.
“States choose to site monitors in areas with higher concentrations and/or higher population since the minimum monitoring requirements are based on population size,” Sullivan said. “Therefore, not all counties have monitors from one year to the next (and those that do have monitors do not necessarily measure every pollutant).”. . READ MORE
RELATED CONTENT
.png)
.jpg)


No comments:
Post a Comment