Get Out There ...and Enjoy The Show >> The Next Few Night are Forcast to Come Alive with Dancing Auroras!
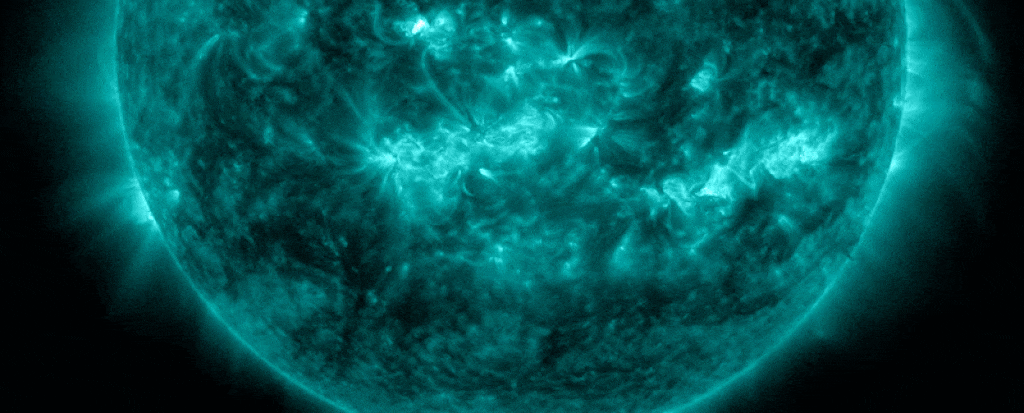
At time of writing,the past 24 hourshad seen six M-class flares andone X-class flareerupt from the Sun. These are bright flashes of light that appear on the surface of the Sun, which coincide with emissions of X-rays and ultraviolet radiation that can cause brief communications blackouts here on Earth.
Cannibal CME Is About to Deliver Spectacular Auroras to Earth's Atmosphere
An X-class solar flare that erupted on 29 July.(NASA SDO)
Rampant solar shenanigans are about to slam Earth and make some real purty lights in the sky.
In recent days our Sun has erupted repeatedly, unleashing several coronal mass ejections (CMEs) and solar flares in Earth's direction. It's unclear when exactly the blasts of CME material will arrive at Earth, but the next few nights are forecast to come alive with dancing auroras.
The reason? There's a cluster of sunspot regions speckling the solar equator, currently rotating right past Earth as it belches out fire and fury. . .
X-class flares are the most powerful flares the Sun can produce; M-class flares are the category just below X-class.
In addition to the solar flares, the Sun has been spewing out huge eruptions of solar plasma tangled with magnetic fields that propagate through the Solar System. These are CMEs, and they sometimes occur with solar flares. Both are strongly associated with sunspot regions, where the solar magnetic field becomes tangled, snaps, and reconnects, unleashing huge bursts of energy.
Sunspots across the solar disk at time of writing. (NASA SDO)
Here on Earth, such activity is unlikely to interfere much with day-to-day life, but CMEs can cause geomagnetic storms when they slam into Earth's magnetosphere. The exchange of energy can cause major disturbances in Earth's magnetic field, upper atmosphere, and plasma environment.
And, of course, there are the auroras. Particles from the CME and solar wind smack into Earth's magnetic field, and get diverted and accelerated along the magnetic field lines to the poles, where they are dumped into Earth's upper atmosphere. There, interactions with particles within the ionosphere creates beautiful glowing lights, with different colors depending on the particles involved.
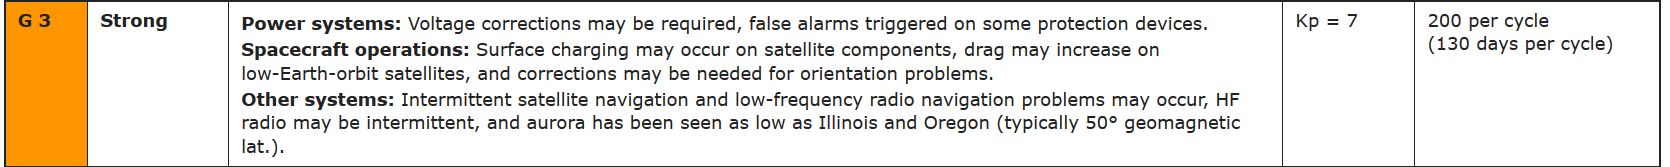
Earlier this year, we saw the most powerful geomagnetic storms in decades, categorized at the G5 "extreme" level. The incoming storms are not expected to be quite that powerful, but they are still forecast to be pretty amazing with some reaching G3, classified as "strong", thanks to a phenomenon called a cannibal CME that produces an enhanced delivery of solar material.
A cannibal CME occurs when two CMEs occur in relatively quick succession. If the second CME is traveling faster than the first, it will catch up and 'swallow' the slower one, becoming, in effect, one huge rolling wave of solar material heading through the Solar System.
Even more excitingly, these currently incoming CMEs are from a glancing blow. At the time they were released, the sunspots were not quite aligned in the direction of Earth.
The rotation of the Sun has brought the spots into the middle of the solar disk, where they are positioned for maximum impact should the solar rampage continue.
With the Sun's activity peak in full swing, there's no reason to believe that it won't. So get out there, and enjoy the show.
This is an AI Free Zone! Text created by Large Language Models is spreading rapidly across the Internet. It's well-written, artificial, frequently inaccurate. If you find a mistake on Spaceweather.com, rest assured it was made by a real human being.
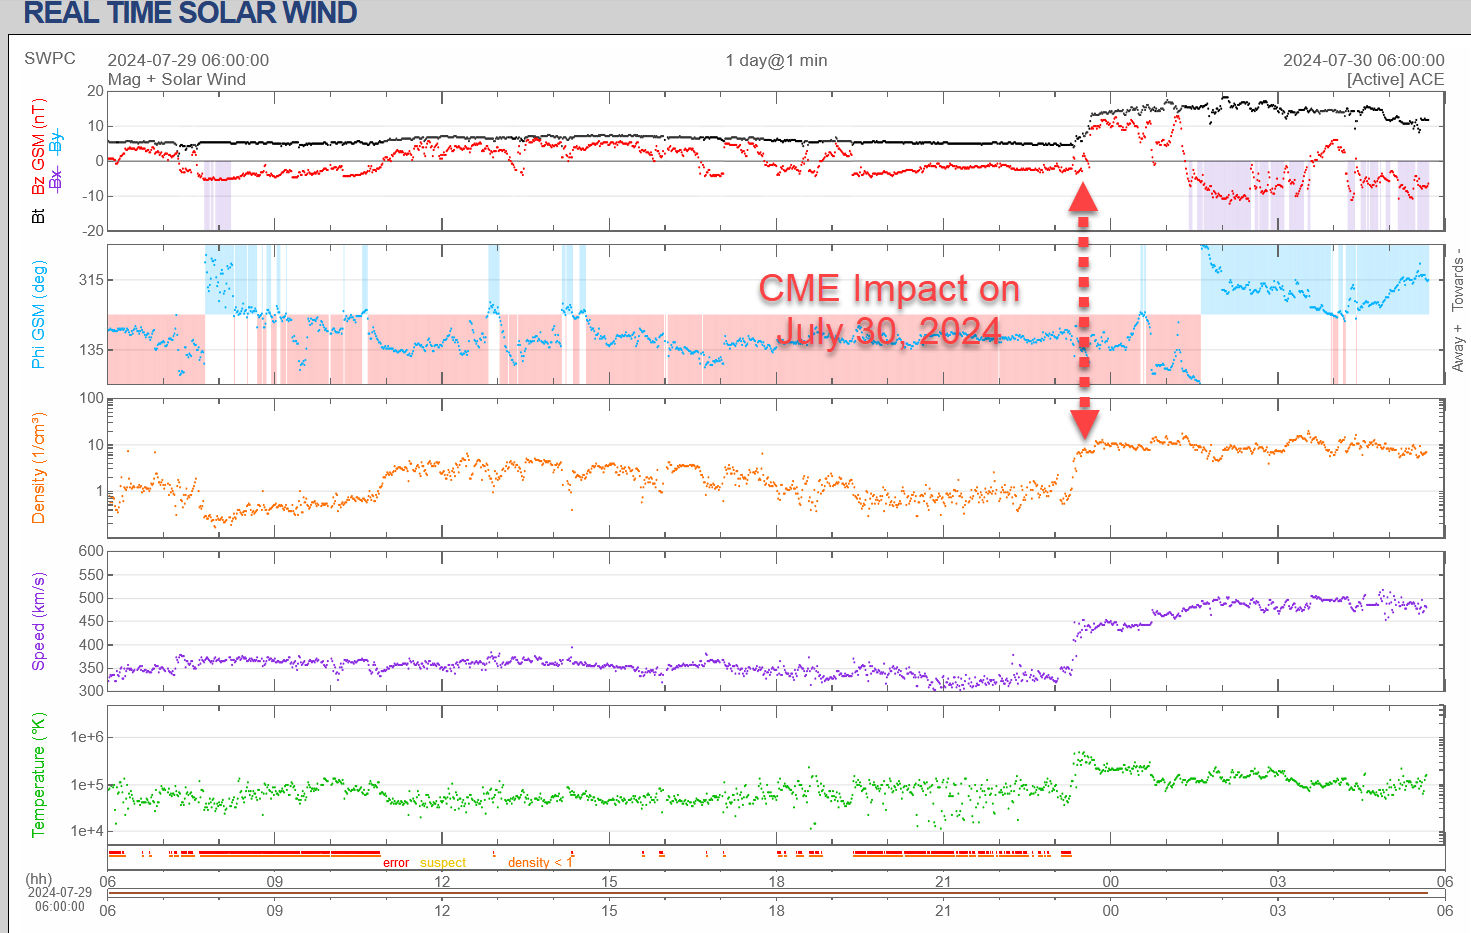
EARLY CME IMPACT: A coronal mass ejection (CME) struck Earth's magnetic field on July 30th at 0027 UT. The impact sparked a minor G1-class geomagnetic storm with faint auroras over some northern-tier US States. This is not what we expected from a potent Cannibal CME. In fact, the Cannibal might still be coming; a NOAA forecast model suggests an arrival time later on July 30th. Stay tuned. CME Impact alerts:SMS Text
ANATOMY OF A CANNIBAL CME: Over the weekend, the sun hurled multiple CMEs directly toward Earth. Individually, none of the CMEs was particularly impressive, but together they joined forces to form a potentially-potent "Cannibal CME." This NOAA model shows the process in action:
The model shows as many as four CMEs mashing together to form a single storm front. It begins on July 27th when two closely-spaced CMEs left the sun and immediately merged. Thus "cannibalized," they traveled toward Earth, snowplowing the solar wind in front of them. A third CME followed on July 28th. It raced through the void created by the first two, easily catching them. A fourth CME on July 29th will combine with the others after they pass Earth.
The combined effect of these CMEs (a triple-cannibal followed by one or two stragglers) could spark strong G3-class geomagnetic storms on July 30-31. If such a storm materializes, auroras should be visible at mid-latitudes across Europe and the USA. Aurora alerts:SMS Text
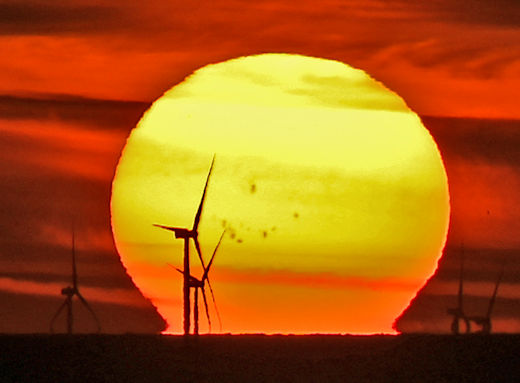
SUNSPOT SUNSET: The source of all these CMEs is massive sunspot complex AR3764-67. Jan Koeman photographed them at sunset from the beach in Domburg, the Netherlands:
"As Solar Max comes nearer, the solar disk is peppered with amazing sunspots," says Koeman. "No filter was needed to image these, together with the windmills in the North Sea."
Caution: Even when the sun is hanging low and dimmed by haze and smoke, it is still dangerous. Sunlight magnified by optics can damage your eyes. If you want to photograph the sun without a solar filter, use the camera's LCD screen as a viewfinder. Never look through the optics!
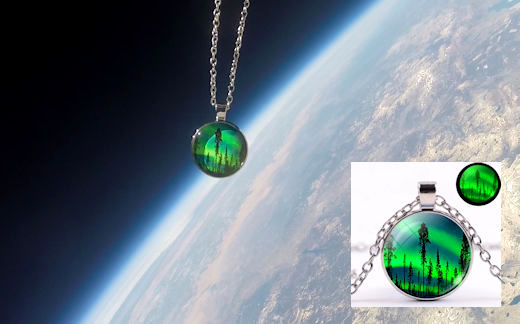
GLOW-IN-THE-DARK AURORA PENDANT: Are you looking for a far-out gift? Consider the Glow-in-the-Dark Aurora Pendant. On July 8, 2024, it flew to the stratosphere onboard an Earth to Sky Calculus cosmic ray research balloon:
You can have it for $99.95. For 3 hours, the necklace floated 106,444 feet above the Sierra Nevada mountains of central California while radiation sensors inside the balloon's payload gathered data for the students' cosmic ray monitoring project. It comes with a greeting card showing the pendant in flight and explaining the Earth to Sky Calculus radiation experiment.
The students of Earth to Sky Calculus are selling space jewelry to support their cosmic ray ballooning program. Don't wait for Christmas--get yours now!
Every night, a network of NASA all-sky cameras scans the skies above the United States for meteoritic fireballs. Automated software maintained by NASA's Meteoroid Environment Office calculates their orbits, velocity, penetration depth in Earth's atmosphere and many other characteristics. Daily results are presented here on Spaceweather.com.
On Jul 29, 2024, the network reported 11 fireballs. (7 sporadics, 2 alpha Capricornids, 1 Perseid, 1 southern Delta Aquariid)
In this diagram of the inner solar system, all of the fireball orbits intersect at a single point--Earth. The orbits are color-coded by velocity, from slow (red) to fast (blue). [Larger image] [movies]
Near Earth Asteroids
Potentially Hazardous Asteroids (PHAs) are space rocks larger than approximately 100m that can come closer to Earth than 0.05 AU. None of the known PHAs is on a collision course with our planet, although astronomers are finding new ones all the time.
On July 30, 2024 there were 2349 potentially hazardous asteroids.
Notes: LD means "Lunar Distance." 1 LD = 384,401 km, the distance between Earth and the Moon. 1 LD also equals 0.00256 AU.
Cosmic Rays in the Atmosphere
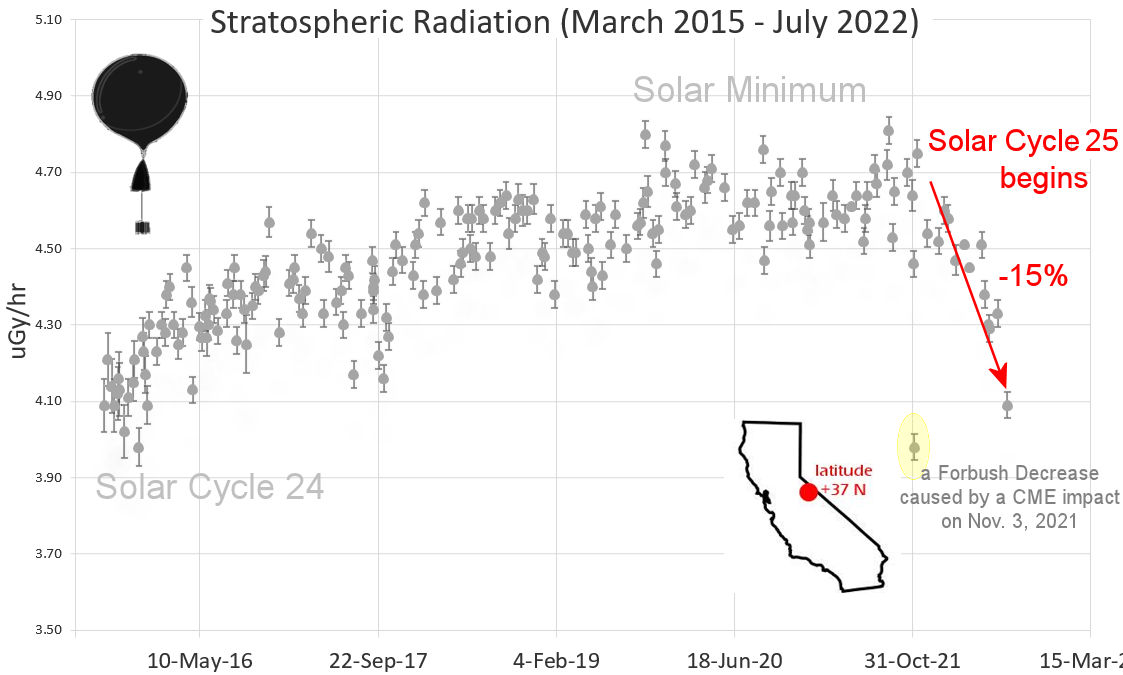
SPACE WEATHER BALLOON DATA: Almost once a week, Spaceweather.com and the students of Earth to Sky Calculus fly space weather balloons to the stratosphere over California. These balloons are equipped with sensors that detect secondary cosmic rays, a form of radiation from space that can penetrate all the way down to Earth's surface. Our monitoring program has been underway without interruption for 7 years, resulting in a unique dataset of in situ atmospheric measurements.
Latest results (July 2022): Atmospheric radiation is decreasing in 2022. Our latest measurements in July 2022 registered a 6-year low:
What's going on? Ironically, the radiation drop is caused by increasing solar activity. Solar Cycle 25 has roared to life faster than forecasters expected. The sun's strengthening and increasingly tangled magnetic field repels cosmic rays from deep space. In addition, solar coronal mass ejections (CMEs) sweep aside cosmic rays, causing sharp reductions called "Forbush Decreases." The two effects blend together to bring daily radiation levels down.
.Who cares? Cosmic rays are a surprisingly "down to Earth" form of space weather. They can alter the chemistry of the atmosphere, trigger lightning, and penetrate commercial airplanes. According to a study from the Harvard T.H. Chan school of public health, crews of aircraft have higher rates of cancer than the general population. The researchers listed cosmic rays, irregular sleep habits, and chemical contaminants as leading risk factors. A number of controversial studies (#1, #2, #3, #4) go even further, linking cosmic rays with cardiac arrhythmias and sudden cardiac death.
Technical notes: The radiation sensors onboard our helium balloons detect X-rays and gamma-rays in the energy range 10 keV to 20 MeV. These energies span the range of medical X-ray machines and airport security scanners.
Data points in the graph labeled "Stratospheric Radiation" correspond to the peak of the Regener-Pfotzer maximum, which lies about 67,000 feet above central California. When cosmic rays crash into Earth's atmosphere, they produce a spray of secondary particles that is most intense at the entrance to the stratosphere. Physicists Eric Regener and Georg Pfotzer discovered the maximum using balloons in the 1930s and it is what we are measuring today.
 An X-class solar flare that erupted on 29 July. (NASA SDO)
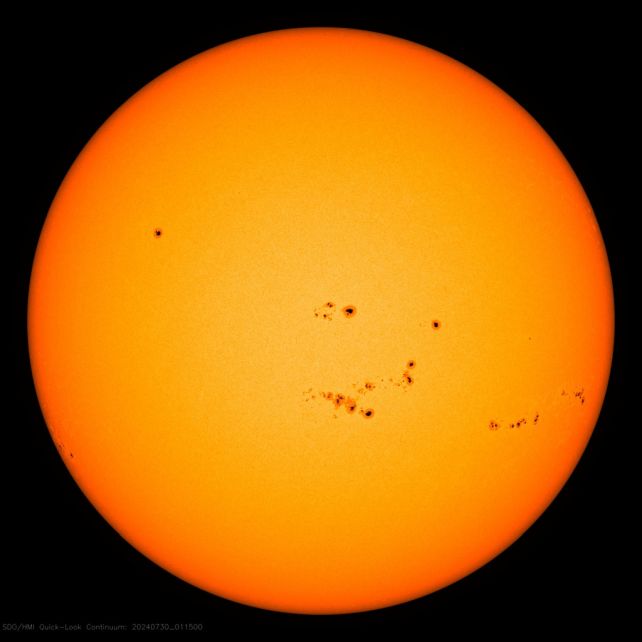


No comments:
Post a Comment