Tuesday, July 20, 2021

Making-The-News: Public Relations, Private Contacts, Spokepersons, Social Media, Mad-Hatters, Journalists, Talking-Heads,Reporters, Marketeers, Media Influencers

Interesting report today

Journalists Want Respect From PR Pros

"More than 80 percent of the journalists surveyed in a new study say that they still depend on PR professionals for news. However, more than half (53%) say that the information they receive is often inaccurate.

GRCThe 2021 PR Media Report, conducted by Global Results Communications, polled 1,026 journalists between March and May of this year, asking them how they view PR practitioners. More than 80% of the journalists surveyed in a new study say that they still depend on PR professionals for news.

However, more than half say that the information they receive is often inaccurate.

> A large majority of respondents value the relationship between journalists and PR pros. Only 10% said that their relationships with PR professionals were “not important.” Close to two-thirds (62%) said the relationship was an important one, and over a quarter (28%) called PR people “a core resource.”

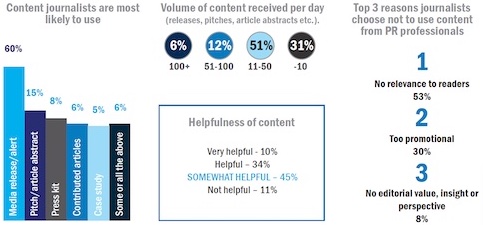
When it comes to what kind of content journalists are most likely to use, the media release is number-one by a long shot, with 60% of respondents citing it as the top source. Such content as pitches/article abstracts (15%), press kits (8 %) and contributed articles (6%) lagged considerably behind.

> Opinions about the helpfulness of content received from PR pros vary considerably. While only 11% label such content as “not helpful,” an even smaller number (10%) rank it as “very helpful.” Most respondents landed somewhere in the middle, with 34% ranking the content they receive as “helpful” and 45% as “somewhat helpful.”

> Respondents were also asked how many pieces of content they receive per day. More than half (51%) said the daily total was somewhere between 11 and 50, and 31%  received 10 or less. On the other end, 6% said that get more than 100 pieces of content per day, with 12% getting between 51 and 100.

> The main reason for a piece of content to not be used, respondents said, was that it had “no relevance to readers,” which was cited by 53 percent. About a third (30%) said they steer clear of content that they deem “too promotional,” and 8% said they had turned down content that had “no editorial value, insight or perspective.”

> What respondents want is “respect/understanding of what journalists need.” Almost half (45%) said that was the quality they most appreciate in a PR professional. However, more than half (56%) also said that was the area most in need of improvement.

“Overwhelmingly, members of the media want relevance and mutual respect,” said GRC founder and CEO Valerie Christopherson. “As the landscape of news dramatically changes, there no doubt, it is time for PR to change, too.”

Category: PR Research 

========================================================================

U.S. PR Firm Rankings - Public Relations Directory - O'Dwyer's PR NewsADDED INFORMATION

Top PR Firms - 2021 Rankings

1. Edelman, New York - $840M
2. Real Chemistry, San Fran. - $360.2M
3. APCO Worldwide, D.C. - $142.9M
4. Finn Partners, New York - $108.8M
5. ICR, New York - $105.9M
6. Ruder Finn, New York - $87.7M
7. Zeno Group, New York - $85.9M
8. Prosek Partners, New York- $61.9M
9. Hotwire, New York - $41.7M
10. MWWPR, New York - $38.8M


Top PR Firms - 2021 Firm Rankings

PR firms with Major U.S. Operations (ranked by worldwide fees)

    O'Dwyer's has been conducting its PR firm rankings for 52 years. PR firms have distinctive financials. At least half of income is used for staff pay. Our rankings measure counseling and media contact services, not advertising or production expenses. 

U.S. PR Firm Rankings - Public Relations Directory - O'Dwyer's PR News

PR Firms by Specialty

Agriculture | Automotive/Transportation | Beauty/Fashion/Lifestyle | Education | Energy | Entertainment/Cultural | Env./Sustain./Greentech/PA | Financial PR/IR | Food & Beverage | Healthcare | Home Furnishings | Industrial | Non-Profits | Professional Svcs. | Purpose/CSR | Real Estate Fin. & Dev. | Sports | Technology | Travel & Economic Dev.

PR Firms by City/Region

Atlanta | Chicago | Connecticut | Boston | Florida | Los Angeles | Miami | Midwest | New York & NJ | Pennsylvania | San Francisco | Southeast | Texas | Wash., D.C. | West

Past Rankings

2020 | 2019 | 2018 | 2017 | 2016


Sort By: Firm | 2020 Net Fees | % Change from '19

#FirmCity, StateFT Emp.
'20 Net Fees
% Chg.
from
'19
1
Edelman
EdelmanNew York, NY5,143$840,022,000
-5.8
2
Real Chemistry
Real ChemistrySan Francisco, CA1,350$360,187,000
61.0
3
APCO Worldwide
APCO WorldwideWashington, DC799$142,960,000
1.0
4
Finn Partners
Finn PartnersNew York, NY745$108,897,000
-8.7
5
ICR
ICRNew York, NY260$105,955,111
20.0
6
Ruder Finn Inc.
Ruder Finn Inc.New York, NY732$87,775,000
13.0
7
Zeno Group
Zeno GroupNew York, NY513$85,994,010
8.5
8
Prosek Partners
Prosek PartnersNew York, NY209$61,950,000
13.2
9
Hotwire
HotwireNew York, NY253$41,748,611
2.0
10
MWWPR
MWWPRNew York, NY160$38,878,161
-9.0
11
5W Public Relations
5W Public RelationsNew York, NY169$38,092,948
12.6
12
imre, LLC
imre, LLCBaltimore, MD185$36,739,100
10.2
13
Padilla
PadillaMinneapolis, MN165$35,862,295
-4.0
14
Kivvit
KivvitChicago, IL123$34,069,946
3.0
15
French | West | Vaughan
French | West | VaughanRaleigh, NC122$33,159,488
2.7
16
Spectrum
SpectrumWashington, DC120$32,900,000
0.0
17
Hunter
HunterNew York, NY161$31,600,000
30.0
18
Evoke KYNE
Evoke KYNENew York, NY139$30,984,000
24.0
19
Crosby
CrosbyAnnapolis, MD99$29,092,172
18.6
20
Coyne PR
Coyne PRParsippany, NJ139$28,000,000
-13.0
21
G&S Business Communications
G&S Business CommunicationsNew York, NY142$25,111,105
-18.0
22
Fahlgren Mortine (includes TURNER)
Fahlgren Mortine (includes TURNER)Columbus, OH165$24,991,200
-15.0
23
Highwire PR
Highwire PRSan Francisco, CA87$24,163,050
23.3
24
Citizen Relations
Citizen RelationsLos Angeles, CA152$23,410,631
-7.4
25
PAN Communications
PAN CommunicationsBoston, MA148$23,359,021
4.6
26
Havas Formula
Havas FormulaNew York, NY118$22,673,654
-11.5
27
Matter Communications
Matter CommunicationsBoston, MA167$22,540,000
-2.7
28
Jackson Spalding
Jackson SpaldingAtlanta, GA103$20,902,415
-15.4
29
Walker Sands
Walker SandsChicago, IL129$20,169,584
7.1
30
Taylor
TaylorNew York, NY86$19,700,000
-2.0
31
Inkhouse
InkhouseWaltham, MA111$19,182,393
-4.9
32
Regan Communications Group
Regan Communications GroupBoston, MA101$18,157,434
-4.2
33
LaunchSquad
LaunchSquadSan Francisco, CA103$16,376,510
-12.0
34
Zimmerman Agency
Zimmerman AgencyTallahassee, FL46$15,400,000
0.0
35
Hoffman Agency, The
Hoffman Agency, TheSan Jose, CA34$15,115,000
1.0
36
JPA Health
JPA HealthWashington, DC64$14,818,927
44.0
37
Bravo Group, Inc.
Bravo Group, Inc.Harrisburg, PA70$14,562,475
0.0
38
M Booth Health
M Booth HealthNew York, NY43$14,433,794
-12.0
39
Bliss Group, The
Bliss Group, TheNew York, NY57$14,221,393
28.9
40
Lambert
LambertGrand Rapids, MI74$13,650,000
29.1
41
Marathon Strategies
Marathon StrategiesNew York, NY40$13,504,883
15.0
42
rbb Communications
rbb CommunicationsMiami, FL78$13,091,113
-7.0
43
JeffreyGroup
JeffreyGroupMiami, FL233$12,448,292
-6.0
44
Vested
VestedNew York, NY30$12,409,000
18.0
45
Racepoint Global
Racepoint GlobalBoston, MA57$11,912,000
-35.0
46
Davies
DaviesSanta Barbara, CA34$11,750,000
4.7
47
Gregory FCA
Gregory FCAArdmore, PA79$10,780,275
-5.0
48
MP&F Strategic Communications
MP&F Strategic CommunicationsNashville, TN66$9,931,133
4.8
49
Moore, Inc.
Moore, Inc.Tallahassee, FL38$9,452,995
7.0
50
Development Counsellors Int'l (DCI)
Development Counsellors Int'l (DCI)New York, NY55$9,410,923
-5.7
51
J Public Relations
J Public RelationsNew York, NY53$9,119,000
-20.3
52
Clarity
ClarityNew York, NY65$9,035,115
47.0
53
360PR+
360PR+Boston, MA49$8,575,221
-17.0
54
Peppercomm
PeppercommNew York, NY27$8,312,989
-7.3
55
MMGY NJF
MMGY NJFNew York, NY39$8,203,073
-23.0
56
Greentarget Global LLC
Greentarget Global LLCChicago, IL37$8,184,000
-6.6
57
Sam Brown Inc.
Sam Brown Inc.Wayne, PA51$8,001,820
26.2
58
Stanton
StantonNew York, NY26$7,572,300
9.1
59
Merritt Group
Merritt GroupMcLean, VA35$7,542,661
0.0
60
Lou Hammond Group
Lou Hammond GroupNew York, NY40$7,350,509
-9.0
61
Pierpont Communications
Pierpont CommunicationsHouston, TX32$6,802,560
-2.0
62
Bospar
BosparSan Francisco, CA37$6,632,137
16.5
63
McCabe Message Partners
McCabe Message PartnersWashington, DC39$6,407,087
10.7
64
Dukas Linden Public Relations
Dukas Linden Public RelationsNew York, NY24$6,396,315
1.1
65
Rasky Partners, Inc.
Rasky Partners, Inc.Boston, MA22$5,902,120
-19.0
66
Berk Communications
Berk CommunicationsNew York, NY24$5,707,363
32.5
67
Singer Associates Public Relations, Inc.
Singer Associates Public Relations, Inc.San Francisco, CA19$5,682,442
4.0
68
Infinite Global
Infinite GlobalNew York, NY29$5,609,950
-5.9
69
Touchdown PR
Touchdown PRAustin, TX12$5,600,633
14.7
70
720 Strategies
720 StrategiesWashington, DC18$5,281,963
40.0
71
Lumina Communications
Lumina CommunicationsSan Jose, CA27$5,204,425
13.0
72
Tunheim
TunheimMinneapolis, MN22$5,170,757
4.3
73
SourceCode Communications
SourceCode CommunicationsNew York, NY27$5,168,512
52.0
74
Raffetto Herman Strategic Communications
Raffetto Herman Strategic CommunicationsSeattle, WA28$5,119,092
64.0
75
Trevelino/Keller
Trevelino/KellerAtlanta, GA30$4,886,767
10.0
76
Public Communications Inc.
Public Communications Inc.Chicago, IL36$4,804,411
13.7
77
LaVoie Health Science
LaVoie Health ScienceBoston, MA17$4,459,686
36.0
78
MCS Healthcare Public Relations
MCS Healthcare Public RelationsBedminster, NJ17$4,405,889
1.0
79
L.C. Williams & Associates
L.C. Williams & AssociatesChicago, IL18$4,206,450
-11.0
80
BackBay Communications
BackBay CommunicationsBoston, MA16$4,086,462
11.0
81
Standing Partnership
Standing PartnershipSt. Louis, MO17$3,970,006
9.4
82
March Communications
March CommunicationsBoston, MA23$3,869,104
-17.0
83
TruePoint Communications
TruePoint CommunicationsDallas, TX28$3,726,153
20.0
84
Champion Management Group
Champion Management GroupDallas, TX20$3,691,386
3.2
85
Idea Grove
Idea GroveDallas, TX28$3,577,000
7.2
86
Fish Consulting
Fish ConsultingFort Lauderdale, FL23$3,473,116
-7.1
87
Brownstein Group
Brownstein GroupPhiladelphia, PA15$3,442,304
1.0
88
BoardroomPR
BoardroomPRFt. Lauderdale, FL17$3,400,000
13.0
89
CashmanKatz
CashmanKatzGlastonbury, CT24$3,325,000
4.5
90
Caliber Corporate Advisors
Caliber Corporate AdvisorsNew York, NY16$3,270,780
11.0
91
Serendipit
SerendipitPhoenix, AZ29$3,070,461
20.0
92
Lovell Communications
Lovell CommunicationsNashville, TN17$3,066,369
3.8
93
Crenshaw Communications
Crenshaw CommunicationsNew York, NY15$3,061,499
0.0
94
ARPR
ARPRAtlanta, GA17$3,022,086
14.9
95
Hawkins Int'l Public Relations
Hawkins Int'l Public RelationsNew York, NY22$2,991,360
-49.0
96
IW Group, Inc.
IW Group, Inc.West Hollywood, CA10$2,985,370
0.0
97
Cerrell Associates
Cerrell AssociatesLos Angeles, CA15$2,918,614
-19.8
98
Zapwater Communications, Inc.
Zapwater Communications, Inc.Chicago, IL23$2,900,376
-14.0
99
Brandware
BrandwareAtlanta, GA13$2,820,232
1.0
100
Ehrhardt Group, The
Ehrhardt Group, TheNew Orleans, LA17$2,806,267
4.0
101
Hewes Communications
Hewes CommunicationsNew York, NY7$2,705,723
-2.0
102
BLAZE
BLAZESanta Monica, CA12$2,559,300
0.0
103
Hodges Partnership, The
Hodges Partnership, TheRichmond, VA16$2,537,332
19.6
104
Lansons Intermarket
Lansons IntermarketNew York, NY13$2,473,605
NA
105
Montieth & Company
Montieth & CompanyNew York, NY13$2,357,623
20.4
106
SPM Communications
SPM CommunicationsDallas, TX16$2,236,134
-3.3
107
Beehive Strategic Communication
Beehive Strategic CommunicationSt. Paul, MN10$2,234,463
-35.0
108
Landis Communications
Landis CommunicationsSan Francisco, CA7$2,100,062
2.0
109
Bellmont Partners
Bellmont PartnersMinneapolis, MN13$2,070,753
3.0
110
Ripp Media/Public Relations, Inc.
Ripp Media/Public Relations, Inc.New York, NY7$2,000,000
-25.0
111
Stanton Communications
Stanton CommunicationsWashington, DC10$1,977,988
-1.0
112
O'Malley Hansen Communications
O'Malley Hansen CommunicationsChicago, IL10$1,935,060
-11.3
113
FrazierHeiby
FrazierHeibyColumbus, OH14$1,779,362
0.0
114
Butler Associates, LLC
Butler Associates, LLCNew York, NY8$1,547,713
4.7
115
AMP3 Public Relations
AMP3 Public RelationsNew York, NY8$1,442,023
26.4
116
Buchanan Public Relations
Buchanan Public RelationsBryn Mawr, PA7$1,293,586
-17.0
117
Buttonwood Communications Group
Buttonwood Communications GroupNew York, NY8$1,291,188
6.5
118
WordWrite Communications LLC
WordWrite Communications LLCPittsburgh, PA8$1,247,312
-19.7
119
Marketing Maven Public Relations
Marketing Maven Public RelationsCamarillo, CA9$1,218,152
1.4
120
Hemsworth Communications
Hemsworth CommunicationsFt. Lauderdale, FL16$1,148,669
-35.7
121
Akrete
AkreteEvanston, IL5$1,133,507
-26.0
122
Pineapple Public Relations
Pineapple Public RelationsChamblee, GA8$1,089,067
-18.5
123
Rosica Communications
Rosica CommunicationsFair Lawn, NJ5$973,955
4.0
124
Perry Communications Group, Inc.
Perry Communications Group, Inc.Sacramento, CA8$960,053
-25.3
125
CommCentric Solutions, Inc.
CommCentric Solutions, Inc.Tampa, Fl7$897,706
0.0
126
Agency Ten22
Agency Ten22Cumming, GA4$867,365
7.9
127
Bob Gold & Associates
Bob Gold & AssociatesRedondo Beach, CA8$823,443
-22.9
128
Hoyt Organization Inc., The
Hoyt Organization Inc., TheTorrance, CA6$810,000
-26.0
129
BizCom Associates
BizCom AssociatesPlano, TX9$772,511
1.0
130
Bianchi Public Relations
Bianchi Public RelationsTroy, MI4$772,147
-1.0
131
Violet PR
Violet PRMontclair, NJ4$699,370
0.0
132
Lawlor Media Group
Lawlor Media GroupNew York, NY7$673,552
-20.0
133
Stuntman PR
Stuntman PRNew York, NY4$616,208
-3.5
134
Feintuch Communications
Feintuch CommunicationsNew York, NY3$575,314
17.9
135
Pugh & Tiller PR, LLC
Pugh & Tiller PR, LLCAnnapolis, MD3$494,706
NA
136
Judge Public Relations, LLC
Judge Public Relations, LLCTampa, FL3$474,942
-12.4
137
Press Record Communications
Press Record CommunicationsNew York, NY1$248,977
204.1


The firms ranked above have satisfied the O'Dwyer ranking rules – supporting fee and employee totals with income tax and W-3 forms and providing a current account list. O'Dwyer's rankings should be regarded as an expression of our judgment of a firm's standing within the industry, and are not warranted to comply with any specific objective standards.

Become an O'Dwyer's Ranked PR Firm

Complete list of firms, both ranked and un-ranked, which you can research on odwyerpr.com


Profiles of Top Independent PR Firms, O'Dwyer's Magazine - May 2021

O'Dwyer's magazine, now in its 35th year, is the #1 publication for PR and marketing communications pros. The magazine has been in full text on LexisNexis since 1989--the only PR magazine on LN.

Each month, a different area of PR is examined. Issues include practice-area specific feature stories as well as profiles of PR firms with strengths in the focus area of the month. The agency profiles constitute the ideal starting point for companies beginning their search for PR counsel. Areas examined include technology, healthcare, financial, travel and fashion to name a few. Consult our editorial calendar for more information.

 Printer Friendly


____________________________________________________________________________
hhh

Monday, July 19, 2021

Make Way - and a Great Deal of Time - for these Announcements from The National Bureau For Economic Research

TODAY there was this announcement
Business Cycle Dating Committee Announcement July 19, 2021
Determination of the April 2020 Trough in US Economic Activity
===========================================================================
INSERT: First this >
The Reporter: No. 2, June 2021

Program Report: Productivity, Innovation, and Entrepreneurship

The Productivity, Innovation, and Entrepreneurship (PIE) Program was founded as the Productivity Program, with Zvi Griliches as the inaugural program director, in 1978. The program benefited tremendously from Griliches’ inspirational leadership, which was continued by Ernst Berndt. In recent years, the program has expanded to incorporate the vibrant and growing body of research in the affiliated fields of innovation and entrepreneurship.

With the generous support of the Ewing Marion Kauffman and Alfred P. Sloan Foundations, the program has generated a large and diverse volume of research activity. Currently, 128 researchers are affiliated with the PIE Program. Since the last program report, in September 2013, affiliates have distributed more than 1,050 working papers and edited or contributed to several research volumes, including the annual Innovation Policy and the Economy series.

The activities of the program are organized into four large project areas: economic research on the measurement and drivers of productivity growth; innovation, which examines R&D, patenting, and creative activities; entrepreneurship, which focuses on the measurement, causes, and effects of new business creation; and digitization, which focuses on the creation, use, and impact of digital information. This review summarizes the research in the first three of these areas.1 In the interest of space, we will not detail the PIE group’s many activities, including boot camps for graduate students and an annual conference in Washington that communicates research findings to the policy community.

Productivity

Program Report figure 1.jpg
Figure 1

Recent years have seen growing concerns that US gross domestic product (GDP) growth is slowing. A factor that accounts for about half of this slowdown is the decline of labor productivity growth [Figure 1], which fell by roughly half, from 3 percent to 1.5 percent, between 1950 and 2019. The other half of slowing growth is due to declining growth of labor hours, due roughly equally to declining population growth and declining labor force participation.2 National productivity is defined as the amount of GDP that can be obtained with a given set of inputs. In this sense, productivity growth is “growth by inspiration” in that it yields more from less, in contrast to growth from increasing the use of inputs, which has been labeled “growth by perspiration.” As such, productivity growth is critical to driving long-run increases in the standard of living.

One immediate question is whether the productivity growth slowdown is real. An alternative view is that the observed slowdown in productivity growth could be an artifact of some measurement issue such as the increasing importance of online activity, much of which may not be recorded in conventional GDP statistics. Several recent studies argue against this view: they conclude that the decline in productivity growth is real, rather than due to measurement issues in inputs and outputs, transfer pricing, or cyclical issues related to the end of the 1990s information technology boom.3

This then leads to another question: what is driving the fall in productivity? Robert Gordon argues that a combination of headwinds accounts for this slowdown.4

>  One is the slowing growth of educational attainment, which began around 1980 with the annual growth rate of the percentage of the population completing high school falling from 3.3 percent per year until 1980 to only 0.2 percent after 1980, with similar slowdowns in college enrollment growth.

> The second headwind Gordon highlights is the slowdown of productivity growth after the end of the Great Inventions Era. He argues that inventions such as sanitation, antibiotics, steam and electric power, radio, telephone, and air conditioning drove rapid national growth during the first part of the 20th century, and that comparably high-impact inventions have not been produced as frequently in recent years. > Nicholas Bloom, Charles Jones, John Van Reenen, and Michael Webb build on this idea, arguing empirically that new ideas like these great inventions are becoming increasingly hard to find.5 They document that innovation output per R&D dollar or per scientist is falling, perhaps because the lower-hanging fruits on the knowledge tree are getting plucked over time.

> A final, more positive headwind may be that the huge productivity benefits derived from modern information communication technologies (ICT) like computers, the internet, and smartphones take time to show up in national productivity. Erik Brynjolfsson, Daniel Rock, and Chad Syverson argue that since it took almost 50 years in the first half of the 20th century to incorporate electricity fully into modern factories and offices, we should be more patient in looking for the productivity impact of ICT.6

This is the ICT productivity J-curve — an initially slow productivity impact as society has to reorganize to use these new technologies efficiently, but a longer-run acceleration once they are effectively exploited.

Following this narrative, a reasonable outlook is that these modern great inventions will eventually raise productivity growth, overcoming some of the first two headwinds. But it may take another 10 or 20 years for society to reorganize itself to exploit them. Of course, one step toward that has potentially been the massive shift to working from home during the pandemic, for which ICT has been invaluable.7 Indeed, one could argue this almost certainly improved productivity versus any pre-computer version of working from home, so in that sense the enormous productivity impact of modern ICT has already begun.

Innovation. . .A second focus of academics and policymakers in recent years has been trying to understand the causes and consequences of rising inequality in the United States and other developed countries.8

From an innovation policy perspective, several questions are of interest.

Have innovation policies — such as government-awarded market power through patents and antitrust policy decisions — contributed to the observed rise in inequality?

How does inequality at a societal level impact who becomes an inventor and what they invent? Tremendous progress is being made in developing new conceptual frameworks, datasets, and empirical approaches to tackle these questions at both the macro and micro levels.

> At the macro level, two recent studies consider how innovation affects inequality in Schumpeterian growth models.9 One of these studies also leverages variation in the composition of the US Senate Committee on Appropriations to empirically test for a causal link between innovation and inequality, and argues that a 1 percent increase in patents increases the top 1 percent’s income share by 0.2 percent.10

> At the micro level, research in fields such as health economics and labor economics has provided evidence on how innovation affects inequality. David Cutler, Ellen Meara, and Seth Richards-Shubik point out that when the most common causes of death vary across demographic groups, a policy of equalizing the expected marginal benefit of research across diseases can increase cross-group disparities in mortality outcomes.11 Taking this idea to the data, they suggest that National Institutes of Health-funded research increased the Black-White infant mortality gap between 1950 and 2007.

> Two recent studies have explored the link between innovation and earnings inequality. Patrick Kline, Neviana Petkova, Heidi Williams, and Owen Zidar develop a novel firm-level linkage between patent applications and US Treasury firm/worker tax filings, and document that patent allowances raise average earnings at the firm level but also exacerbate within-firm inequality on a number of margins — with earnings of top-earning employees, firm officers, and male employees responding more strongly to patent grants.12

> Related research using a novel firm-level linkage between patents and US Social Security Administration earnings records suggests that rising inequality in innovation activity across firms in the 1990s, as measured by patenting, can account for a significant share of the recent rise in income inequality.13

Program Report figure 2.jpg
Figure 2

Of course, inequality at the societal level might also affect who becomes an inventor, and what they invent.

Several recent studies have constructed linked data enabling new analyses of how demographic factors are associated with the probability of inventing, as measured by patenting.14 Figure 2 documents that children from high-income (top 1 percent) families are 10 times as likely to become inventors as those from below-median-income families. While the results from these papers suggest that public policies could influence who becomes an inventor, it is difficult to derive quantitative conclusions from these descriptive analyses. > An important step in closing this gap is provided by the work of Chang-Tai Hsieh, Erik Hurst, Chad Jones, and Peter Klenow, who estimate that between 20 and 40 percent of the increase in US output per person between 1960 and 2010 can be explained by an improved allocation of talent, notably the convergence in occupations across gender and race.15

Entrepreneurship

Given the concerns about stagnant productivity and rising inequality, it is natural to wonder whether either or both concerns are being — or have the potential to be — addressed by the burgeoning number of new high-potential ventures.

Much attention in recent years has focused on the role of venture capital (VC) in fomenting innovation.

> The level of VC financing has rapidly increased over the last decade, in contrast with federal R&D which has been stagnant in the US. A number of economic models suggest that VC funds should be uniquely positioned to promote innovative growth in risky and uncertain environments, given their combination of careful screening, intense monitoring, and staged financing.16

> The empirical literature, however, suggests a more nuanced picture. VC funding is increasingly concentrated in a relatively small number of startup firms that raise far more capital than in the past and stay private much longer.17

> Much of the funding comes not from the venture investors themselves, but from investors who traditionally focused on public firms, such as mutual and hedge funds, as well as pension funds and other large institutional investors.

This concentration of capital may or may not be socially desirable; after all, the list of long-gestating firms that garnered extensive financing while private would include Alibaba, Facebook, and Uber, each of which undoubtedly has had profound economic impacts. But Josh Lerner and Ramana Nanda argue that while venture funding is very efficacious in stimulating a certain kind of innovative business, the scope is increasingly limited. For instance, using data on the patents filed at the US Patent and Trademark Office, they found that the top 10 patent classes using the US Cooperative Patent Classification (CPC) system represented 48 percent of all US VC patents filed over the 2008–17 period, compared to 24 percent for the top 10 patent classes for patents not filed by comparable VC-backed firms.18 This concentration has increased substantially over time.

This suggestion is underscored by computations by Sand Hill Econometrics. Susan Woodward and Robert Hall describe this firm’s indices, which suggest that an investment in all software deals between December 1991 and September 2019 would have yielded an annualized gross return of 24 percent, far greater than investments in hardware (17 percent), healthcare (13 percent), or clean tech (2 percent).19 These data further illustrate that the divergence in the performance of these categories has been particularly stark in the last decade. Thus, the shift of venture investment to software is not surprising.

> A related concern is the increasing concentration of venture funds in the hands of a number of small groups. Not only are these funds concentrated geographically in a few urban areas, but the makeup of the most influential US firms is very different from that of the country as a whole.

> At VC firms and among the founders of VC-backed startups, women represent less than 10 percent of the entrepreneurial and VC labor pool, Hispanics about 2 percent, and African Americans less than 1 percent.20 This concentration appears despite the fact that women, Hispanics, and African Americans have much higher corresponding levels of representation in education programs that traditionally lead to careers in these sectors, as well as higher rates of representation in other highly compensated professions.

> The disparities are also manifested in financing raised. For instance, using data from the Kauffman Firm Survey, Robert Fairlie, Alicia Robb, and David Robinson show that the typical White-owned firm had 35 times the amount of outside equity financing as the analogous Black-owned firm at the time of the initial survey, a difference that persists over time.21

These findings suggest that while VC is a powerful tool for boosting innovation, it is far from a panacea for addressing rising inequality or stagnant productivity across the economy.

 
===========================================================================

Cambridge, July 19, 2021 - The Business Cycle Dating Committee of the National Bureau of Economic Research maintains a chronology of the peaks and troughs of US business cycles. The committee has determined that a trough in monthly economic activity occurred in the US economy in April 2020. The previous peak in economic activity occurred in February 2020. The recession lasted two months, which makes it the shortest US recession on record.

The NBER chronology does not identify the precise moment that the economy entered a recession or expansion. In the NBER’s convention for measuring the duration of a recession, the first month of the recession is the month following the peak and the last month is the month of the trough. Because the most recent trough was in April 2020, the last month of the recession was April 2020, and May 2020 was the first month of the subsequent expansion.

In determining that a trough occurred in April 2020, the committee did not conclude that the economy has returned to operating at normal capacity. An expansion is a period of rising economic activity spread across the economy, normally visible in real GDP, real income, employment, industrial production, and wholesale-retail sales. Economic activity is typically below normal in the early stages of an expansion, and it sometimes remains so well into the expansion.

The committee decided that any future downturn of the economy would be a new recession and not a continuation of the recession associated with the February 2020 peak. The basis for this decision was the length and strength of the recovery to date.

The Month of the Trough

In determining the date of a monthly peak or trough, the committee considers a number of indicators of employment and production. In the current case, all of those indicators point clearly to April 2020 as the month of the trough. On the employment side, the committee normally views the payroll employment measure produced by the Bureau of Labor Statistics (BLS), which is based on a large survey of employers, as the most reliable comprehensive estimate of employment. This series reached a clear trough in April before rebounding strongly the next few months and then settling into a more gradual rise. However, the committee recognized that this survey was affected by special circumstances associated with the COVID-19 pandemic in early 2020. In the survey, individuals who are paid but not at work are counted as employed, even though they are not in fact working or producing. Workers on paid furlough, who became more numerous during the pandemic, thus resulted in an overcount of people working. Accordingly, the committee also considered the employment measure from the BLS household survey, which excludes individuals who are paid but on furlough. This series also shows a clear trough in April. The committee concluded that both employment series were thus consistent with a business cycle trough in April.

The committee believes that the two most reliable comprehensive estimates of aggregate production are the quarterly estimates of real Gross Domestic Product (GDP) and of real Gross Domestic Income (GDI), both produced by the Bureau of Economic Analysis (BEA). Both series attempt to measure the same underlying concept, but GDP does so using data on expenditure while GDI does so using data on income. These measures estimate production that occurred over an entire quarter and are not available monthly. The most comprehensive income-based monthly measure of aggregate production is real personal income less transfers, from the BEA. The deduction of transfers is necessary because transfers are included in personal income but do not arise from production. This measure reached a clear trough in April 2020. The most comprehensive expenditure-based monthly measure of aggregate production is monthly real personal consumption expenditures (PCE), published by the BEA. This series also reached a clear trough in April 2020.

The Quarter of the Trough

In determining the date of a quarterly peak or trough, the committee relies on real GDP and real GDI as published by the BEA, and on quarterly averages of key monthly indicators. As with the monthly trough, there is strong agreement across the indicators about the timing of the quarterly trough: the indicators all point strongly to 2020Q2. Quarterly real GDP and real GDI both reached clear troughs in 2020Q2, as did quarterly averages of both the monthly payroll and household employment series. 

Further Comments

The NBER’s traditional definition of a recession involves a decline in economic activity that lasts more than a few months. For example, the previous shortest recession occurred in the first half of 1980 and lasted six months.  However, in deciding whether to identify a recession, the committee weighs the depth of the contraction, its duration, and whether economic activity declined broadly across the economy (the diffusion of the downturn). The recent downturn had different characteristics and dynamics than prior recessions. Nonetheless, the committee concluded that the unprecedented magnitude of the decline in employment and production, and its broad reach across the entire economy, warranted the designation of this episode as a recession, even though the downturn was briefer than earlier contractions.

Committee members participating in the decision were: Robert Hall, Stanford University (chair); Robert Gordon, Northwestern University; James Poterba, MIT and NBER President; Valerie Ramey, University of California, San Diego; Christina Romer, University of California, Berkeley; David Romer, University of California, Berkeley; James Stock, Harvard University; Mark Watson, Princeton University.


No more "Kicking-the-can-down-the-road", way-too-late for "Aspirational Goals that Mean Nothing - The Ravages of Climate Change Are At Hand

Water is the most precious thing here in the Desert Southwest and "The Valley of The Sun". That fact is - once again - in the spotlight of one more post on this blog... until the critical nature of this fact sinks in before it is too late:
Time to rethink. It's time to rethink and set new… | by Alexander Roznowski  | IPO 2.0 | Medium

Can the Southwest Survive With Less Water?

"Sometime next month, for the first time, the federal government is likely to declare a water shortage at Lake Mead.

This vast turquoise reservoir, formed in 1935 when the Hoover Dam corked the Colorado River in Arizona and Nevada, is part of a broader network of natural and artificial aqueducts and dams that supplies water to 40 million people and homes, farms, manufacturers and businesses across several states, tribal lands and parts of Mexico. Lights stay on in Phoenix, Tucson, Las Vegas, San Diego, Los Angeles and other Southwestern cities because Hoover Dam hydropower helps generate the region’s electricity.

Conservation drought losangeles GIF on GIFER - by Adorius

But the lake is shrinking, faster and sooner than hydrologists and other experts predicted. A stark white band of dry rock, 120 feet wide, circles its craggy perimeter, marking how far the water line has fallen in the ongoing drought. Locals call it the “bathtub ring.”

Walking Lake Mead’s shoreline in the blistering July sunshine offers other reminders of the receding water. Swimmers gather in an area that they call a beach but is really an exposed portion of the reservoir’s rocky floor — some distance from the place further inland where people used to sunbathe. Marina ramps are closed because the water isn’t high enough to properly launch a boat. Formerly submerged infrastructure supporting enormous “straws” that suck water from the reservoir to be delivered to Las Vegas now tower above the lake. Saddle Island, home to a major water treatment plant, is so parched, it’s no longer an island — it’s a peninsula.

Lake Mead and its troubled fellow reservoir upriver, Lake Powell, symbolize a broader threat. The entire Southwest has been baking in a 21-year drought and in this summer’s successive heat waves, which have also roasted Northwestern states.

Drought worsens in Arizona, over 50% in 'Exceptional Drought'

> How communities and businesses everywhere live with this change — how they adjust to the idea that water is a precious, waning resource rather than an abundant, inexpensive commodity — is being tested in the Southwest. Dry, sizzling summers and warmer winters that restrict water supplies may now be the norm, courtesy of a permanently altered climate. . .

> Interlocking legal agreements, built on earlier pacts dating back at least a century and layered atop a hodgepodge of local rules, govern how Colorado River water is shared among seven states, Native American nations and Mexican territories. In 2019, after years of thorny negotiations over a diminishing water supply, states and the federal government signed the Drought Contingency Plan, which lays out how water will be doled out if a shortage occurs.

> 'Tier 1” looms over conversations about drought in the Southwest in the same way that “rolling blackouts” haunts certain conversations elsewhere. Tier 1 has entered the Southwestern argot because it is the benchmark that will trigger a formal declaration of a water shortage, expected in August.

> Tier 1 also foreshadows further belt-tightening. It suggests that a region of deserts and mountains that has spent a century growing explosively might have to consider downsizing — or, perhaps, right-sizing.

Arizona's water supply could be impacted by continued drought conditions

Tier 1 will most heavily impact Arizona, due to legal and political peculiarities stemming from water battles of the past. Other Colorado River basin states will face more onerous rationing regimes only when further DCP tiers are reached. Then, Arizona’s burden will worsen as well, but even Tier 1 inflicts a severe blow. The state will lose nearly a fifth of the water it has been drawing from the Colorado River.

Exceptional Drought covers nearly 72% of Arizona - WeatherBus.com

It has decided that farmers and ranchers will absorb the entirety of this cut, temporarily sparing municipalities and industry. Farmers in Pinal County, an Arizona breadbasket, expect deliveries from the Colorado River to drop by half next year and disappear altogether in 2023.

> Farms need outsized amounts of water to grow crops. During wet years, so much water could be channeled to central Arizona that it was possible, if inadvisable, to grow cotton, corn, barley and alfalfa in the desert. That may no longer be the case.

> But farms aren’t the only businesses that need water. Cutting-edge factories, including semiconductor plants, require millions of gallons daily. Two heavyweights in the chip industry, Intel Corp. and Taiwan Semiconductor Manufacturing Co., plan to build major plants in Arizona, and those operations will be water-dependent, too. Real estate developers, which routinely unveil master-planned communities in fast-growing Phoenix suburbs and in the Sonoran Desert, also need water, and some groundwater supplies are already strained.

Arizona must answer these 5 critical water questions - and soon

> Arizona has spent decades preparing for droughts, and the state believes it can use water-sharing agreements to aid farmers when the first big cutback happens. Chipmakers have become deft water recyclers and say that they can work with a more limited supply.

> Developers claim to be observing strict local regulations on sustainable water usage. But even experts who have spent their careers tackling water-management issues in the state recognize why this moment resonates.

“We’re about to declare the first water shortage ever on the Colorado River,” says Chuck Collum, a program manager for the Central Arizona Project, an agency that delivers Lake Mead water to the state. “It will be emotional to be here when that happens.”

“This isn’t just an Arizona problem. This is a Colorado River basin problem,” he adds. . .

> Court battles between Arizona and California over water rights took decades more to settle and left the federal government as the arbiter of allotments in the region. But the 1922 compact allowed the basin states to jointly tame the river, ultimately with the Hoover Dam. The river was diverted, the dam’s 726-foot concrete wedge filled the canyon, and the water was allowed to rush back in.

> For the first time, the Colorado River was being directed and managed with a giant faucet. Lake Mead became so voluminous that its weight deformed the earth’s crust and in the 1930s triggered more than 600 minor earthquakes. Like dams before and after, Hoover Dam also disrupted plant, marine and wildlife habitats; unsettled sediment deposits; and created reservoirs that emitted methane and other greenhouse gases.

All that water also enabled the extraordinary manufacturing, agriculture, technology and residential boom in the Southwest. The water’s eventual decline, which started to be felt at the turn of this century, stands to have an equally powerful impact. . .

>

Lake Powell. Justin Sullivan/Getty Images

> "We are not in a state of panic. We’re prepared. We knew it was coming and we’ve been storing water underground,” says Sharon Megdal, director of the University of Arizona Water Resources Research Center. “But the situation is bad and it’s growing worse sooner and faster than we thought it would. Some aren’t going to be able to continue business as usual. They will have to adapt.”

> Arizona has also spent the past 25 years storing about 3 trillion gallons in a network of “water banks” — a supply big enough, the state says, to serve Phoenix for 30 years. Part of that supply was created through artificial above-ground pools that gradually seep through the soil and “recharge” subterranean aquifers.

> But Arizona’s regulatory apparatus isn’t airtight. Some landowners and farmers aren’t bound by its rules and can pump groundwater at will. And there are no uniform legal guidelines around various uses of surface water and groundwater.

While Arizona now uses less groundwater than it did decades ago, waning supplies from Lake Mead have forced it to reconsider that strategy. As the shortage deepens, water banking is likely to be eliminated. Sprawling suburban subdivisions depend on groundwater stocks that will be difficult to replenish. The prospect of aggressively tapping other groundwater supplies in rural areas to make up the difference has sparked a heated debate about environmental impacts — and basic fairness.

A group of University of Arizona researchers who in 2017 wrote a detailed analysis of the state’s water usage found that some of the lofty conservation goals established in 1980 won’t be met, and that the balance between extracting and replenishing groundwater has fallen dangerously out of whack.

> Water is still sold at rock-bottom rates — lower than the cost of electricity — and to facilitate rationing and responsible usage, prices will need to rise. Israel, another desert community, offers a good model for how to orchestrate such a pricing shift. A lot of residential water in states like Arizona is used outdoors, to water plants and trees and fill swimming pools, and this offers an easy target for cutbacks. Seawater desalination plants and wastewater recycling facilities have sprung up around the region. Greater public education about water usage and availability... — would also help.

Water Scarcity GIFs - Get the best GIF on GIPHY


"Not Your Usual Bad Guys" - Yeah! That's for Sure ...A Major Malicious Heist

One more report from Techdirt:

Leaked Data Shows NSO Group's Malware Was Used To Target Journalists, Activists, And World Leaders

from the not-your-usual-bad-guys dept

A massive data leak has confirmed what's been suspected (and reported by security researchers like Citizen Lab) for a long time: Israeli malware developer NSO Group's powerful cellphone snooping tools have been used to target journalists, activists, and dissidents all over the world.

The Guardian and 16 other media outlets have dug into the data leak and uncovered some pretty disturbing info about NSO's Pegasus malware, which allows those deploying the spyware to extract messages, record phone calls, and surreptitiously activate microphones.

Who's in the list of phone numbers seen by the Guardian? Lots and lots and lots of journalists.

The leak contains a list of more than 50,000 phone numbers that, it is believed, have been identified as those of people of interest by clients of NSO since 2016.

[...]

The disclosures begin on Sunday, with the revelation that the numbers of more than 180 journalists are listed in the data, including reporters, editors and executives at the Financial Times, CNN, the New York Times, France 24, the Economist, Associated Press and Reuters.

NSO ran US-based attack servers: Facebook - Security - iTnews

Here's who's included in this first revelation by the Guardian:

[J]ournalists who were selected as possible candidates for surveillance by NSO’s clients work for some of the world’s most prestigious media organisations. They include the Wall Street Journal, CNN, the New York Times, Al Jazeera, France 24, Radio Free Europe, Mediapart, El País, Associated Press, Le Monde, Bloomberg, Agence France-Presse, the Economist, Reuters and Voice of America.

> Also found on the list was the number of Mexican reporter Cecilio Pineda Birto, who was murdered while waiting for his pickup to finish being cleaned at a local car wash. This followed weeks of death threats that began after his reporting accused state police and local government officials of colluding with crime lords.

> It's not just journalists being targeted by NSO's powerful malware.

The list also includes numbers linked to religious figures, executives of private companies, union officials, high-ranking government officials, and NGO employees.

> NSO, for its part, continues to insist it's not the bad guy here. It says it only sells the software to a "select group" of "vetted" government agencies. Unfortunately, that list of approved governments includes notorious human rights violators like the Saudi government (which killed Washington Post reporter Jamal Khashoggi) and agencies in the UAE, Bahrain, and Kazakhstan.

> The government of Mexico is one of NSO's most enthusiastic users. It "selected" 15,000 of the 50,000 numbers recovered in the data leak. This doesn't mean 15,000 successful deployments but it does mean the Mexican government -- which has no shortage of local criminals to target -- also apparently tried to infect phones owned by journalists.

NSO's hands are far from clean. Its list of clients isn't as selective as it likes to pretend. And while it may tell purchasers the spyware should only be used to target criminals and terrorists, it doesn't yank licenses from governments that choose to target journalists, academics, religious figures, and others.

Filed Under: activists, governments, journalists, malware, snooping tools, spyware, surveillance
Companies: nso group


Invisible surveillance: How spyware is secretly hacking smartphones

Apex Legends - Official Metamorphosis Trailer (Stories from the Outlands)

THE U.S. NAVY NEEDS TO PAY ATTENTION: RUSSIA’S SUBMARINE FORCE IS BACK

GREGORY BOVINO: Nazi Cosplay Time in Mineeapolis...Trump's ICE Enforcer

  UPDATE ON SUNDAY 25 JANUARY 2026 Top stories Federal agents fatally shoot Alex Pretti in Minneapolis Star Tribune Fact check: Video, witne...