Late Covid Loans Hurt Recovery in Chicago’s Minority Neighborhoods
Bloomberg is tracking the economic recovery in minority communities across the country
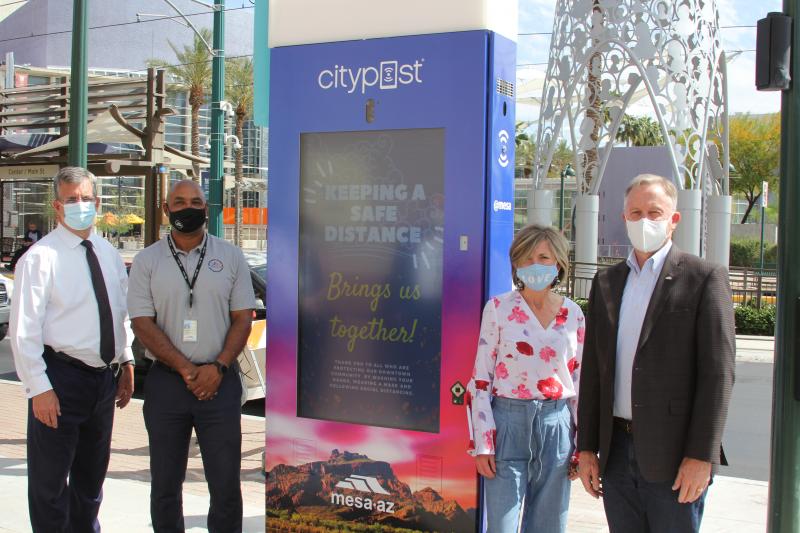
 PRESS RELEASE from City of Mesa Newsroom MesaNow
____________________________________________________________________________

Here's a map of income distributions in the city of Mesa that needs some up-dating to fill-in the data gaps, especially in Southeast Mesa.
The color codes in the red-orange-yellow spectrum show higher-income areas concentrated in north and northeast Mesa. The darker-blue areas show lower-income areas.
[This is zip code data from the 2010 U.S. Census, It may or may not show the census tracts chosen as pre-designated Opportunity Zones, with the exceptions that qualify the NE and SE areas with higher-than-median-income levels but are nonetheless contiguous with distressed and neglected areas.
There are some areas and neighborhoods with a diverse mix.
____________________________________________________________________________
NOTE: Windy City Wealth Gap

Majority racial/ethnic group by zip code:
Median household income (2019)
◼ Black
◼ White
◼ Hispanic
40K
80K
120K
$160K
Rogers
Park
Chicago
Forest
Glen
Edgewater
Jefferson
Park
Lake View
Belmont
Cragin
Logan
Square
Lincoln
Park
Humboldt
Park
Austin
Garfield
Park
Near
West Side
Loop
Lake
Michigan
Lower
West Side
Brighton
Park
Bronzeville
New City
Garfield
Ridge
Englewood
West
Lawn
South
Shore
Grand
Crossing
Ashburn
Calumet
Heights
Roseland
Morgan
Park
West
Pullman
5 miles
Hegewisch
5 km


Early PPP Rounds Favored Richer, Whiter Areas
By the time the Biden administration made changes to the final round of PPP loans in February 2021, focusing on minority-owned and smaller businesses, this area had already received almost all of its relief money—$149 million. Those changes proved more meaningful to non-White zip codes, many of which saw a bump in funds.
One long-running problem for smaller and minority-owned businesses is the lack of established relationships with banks that distributed the PPP forgivable loans. A similar lag in federal aid can be seen in U.S. metro areas including Dallas, Houston, Los Angeles and Philadelphia, data show.
How PPP Reached Minority Areas Differently

Actual loan amount per 100k people
Chicago
Houston
Los Angeles
$200M
150
100
50
0
5/21
4/20
Month loan funded
Miami
New York
Washington, DC
$200M
▲
Peak total loan amount
150
100
50
0


Actual loan amount per 100k people
Chicago
Houston
Los Angeles
$200M
150
Peak total loan amount
▼
100
50
0
5/21
4/20
Month loan funded
Miami
New York
Washington, DC
$200M
150
100
50
0


Actual loan amount per 100k people
Chicago
Houston
Los Angeles
$200M
150
100
50
0
5/21
4/20
Month loan funded
Miami
New York
Washington, DC
$200M
Peak total loan amount
▼
150
100
50
0