Monday, March 14, 2022

Recession Rumbles Grow Louder as Impact of Economic Stimulus Fades

Intro: Inflation is Public Enemy No. 1, just as it was in 1974, with the economy mired in what to that point was the deepest post-World War II recession.

Recession Rumbles Grow Louder as Impact of Economic Stimulus Fades

Last Updated: March 14, 2022 at 8:32 a.m. ET

<div class=__reading__mode__extracted__imagecaption>President Gerald Ford’s 1970s WIN campaign was a loser in the war on inflation.
            AP/Shutterstock

"The real presidents in that era wouldn’t have done any worse by listening to Chauncey rather than to their actual advisers. Back in the fall of 1974, the Ford administration assembled an all-day conference on solutions to the soaring prices besetting the nation. The initial answer—WIN buttons, for Whip Inflation Now—somehow had failed to do the trick, so the White House cast about for alternatives.

The joke was that, unbeknownst to all the assembled experts, the U.S. already was nearly a year into the recession that had begun in November 1973 and wouldn’t end until March 1975. While that escaped the worthies in Washington, Wall Street certainly noticed. Stocks were deep into a truly vicious and protracted bear market.

The Dow Jones Industrial Average wouldn’t bottom until December 1974, at 577.60, down some 45% from its peak above the then-magic Dow 1,000, a mark that wouldn’t be sustainably surpassed until the next decade. The chairman of the president’s Council of Economic Advisers at the time, future Federal Reserve Chairman Alan Greenspan, would comment that stockbrokers probably suffered the most at the time, which didn’t elicit much sympathy from Main Street, where folks were struggling with soaring food and energy prices. The solution from the Fed’s then-chief, Arthur Burns, was to conjure a measure of “core inflation,” which conveniently excluded those nettlesome necessities.

Which brings us to the present. >>

In this deeply divided nation, there is broad agreement from Wall Street to Washington and, especially, Main Street on just one thing: Inflation is Public Enemy No. 1, just as it was in 1974, with the economy mired in what to that point was the deepest post-World War II recession.

The difference now is that the Fed is only about to begin to tighten monetary policy. As of this writing, the central bank’s key federal-funds target rate remains at a rock-bottom 0% to 0.25%. And the Fed didn’t end its humongous asset-purchase program, launched at the outset of the Covid-19 pandemic, until this past Wednesday. Since March 2020, that campaign has doubled the size of the Fed’s balance sheet to nearly $8.9 trillion.

Yet the signs of an economic slowdown are beginning to appear, if not in official forecasts, in the markets.

By the calculations of J.P. Morgan’s global quantitative and derivatives team, led by Nikolaos Panigirtzoglou, the U.S. equity market has priced in a recession probability of 50%, while the investment-grade bond market has discounted a 43% probability of a recession. The high-yield (aka junk) bond market has priced a relatively small 17% probability of recession.

The J.P. Morgan team comes up with those findings via a relatively simple formula. The S&P 500 has declined an average of 26% in the past 11 U.S. recessions. As of the March 8 date of the JPM report, the S&P was off 13%. Thirteen divided by 26 produces a 50% recession probability, using the bank’s formula. The credit markets’ recession forecasts are based on the widening of their respective yield spreads over benchmark Treasuries.

Those recession odds are significantly lower than what the banks’ strategists calculate for the euro zone—some 78%, based on equities over there, and 54% based on European investment-grade bonds. And the calculations were done before the European Central Bank announced this past week that it plans to remove policy accommodation faster than had been expected.

MacroMavens commentator Stephanie Pomboy offers a less simplistic market analysis: Recessions follow from the twin drags of big jumps in long-term interest rates and oil prices. Over the past 30 years, the economy has headed south whenever the sum of the year-over-year change in Baa corporate bond yields, plus the change in oil prices, has topped 100%. That was the case in both the 2000-01 post-dot-com bust and the 2007-09 housing debacle.

Once again, that measure is approaching recession level. Growth is slowing because of demand weakening, as the effects of previous fiscal and monetary stimulus wane. And that was before Russia’s invasion of Ukraine “pushed the price of everything consumers can’t live without toward the sky,” Pomboy writes in a client note.

History may be about to repeat, with the Fed about to belatedly tighten policy, just as the economy slows. Notwithstanding the assurances of latter-day Chauncey Gardiners, growth in the spring could be disappointing."


More On MarketWatch


TEST-TO-TREAT: Major Pharmacist Groups Argue It Won't Work


Test to Treat: pharmacists say Biden’s major new Covid initiative won’t work

Virus Corona GIF by Lieblings-Stück - Find & Share on GIPHY

Program to facilitate access to antivirals will have a limited impact because pharmacists are restricted from prescribing the pills

A major new Biden administration initiative to facilitate access to Covid-19 antivirals will have a limited impact and fail to mitigate certain health inequities, major pharmacist groups argue, because pharmacists are restricted from prescribing the pills.

Announced in Joe Biden’s State of the Union address, the “Test to Treat” program is meant to address the maddening difficulty Americans have had in accessing Covid-19 treatments. The administration will channel newly increasing stocks of antiviral pills to major retail pharmacies that have in-house clinics, providing one-stop testing and antivirals access.

The program, which the administration aims to provide for free (in the face of fierce Republican opposition to new Covid-19 spending), is also slated to roll out in Veterans Affairs clinics, community health centers and long-term care facilities.

Major participants include some 250 Walgreens stores, 225 Kroger Little Clinics and 1,200 CVS MinuteClinics. CVS clinics in particular are staffed by nurse practitioners and physician assistants, authorized by the Food and Drug Administration (FDA) to prescribe the two currently available Covid antivirals, Pfizer’s Paxlovid and Merck and Ridgeback Biotherapeutics’ molnupiravir.

In a 9 March letter to Biden calling for pharmacists to be granted authority to prescribe these pills, 14 organizations representing pharmacies and pharmacists insisted Test to Treat’s impact will be compromised by the fact that such in-house clinics are relatively limited in number and largely in urban areas. . .

Paxlovid and molnupiravir are authorized for individuals at high risk of severe Covid-19, in particular unvaccinated people with certain medical conditions. Paxlovid was 88% effective at preventing hospitalization and death in its clinical trial. Molnupiravir proved just 30% effective. The FDA only authorizes its use when other treatments are unavailable or aren’t advised for an individual.

Sufficient supply of Paxlovid will be key to Test to Treat. Since late December, the federal government has delivered a woefully inadequate 700,000 Paxlovid courses to states, the biweekly allotment increasing from 100,000 in January to 175,000 in March.

The administration has claimed it will distribute 1m courses in March and 2.5m in April. A Pfizer representative would only state that the company plans to deliver a cumulative 10m courses by the end of June. The administration has agreed to purchase 20m courses, slated to be delivered by the end of September.

In September 2021, the US Department of Health and Human Services amended a federal public health emergency law, the Prep Act, to grant licensed pharmacists the authority “to order and administer select Covid-19 therapeutics” – which at the time meant monoclonal antibodies and vaccines.

But when the FDA authorized Paxlovid and molnupiravir in December, it explicitly restricted pharmacists from prescribing them. . .

> These groups have also lobbied the federal government to ensure Medicare Part B would reimburse pharmacists for such prescribing – a move that would likely lead health insurers to follow.

Prescribing Paxlovid safely can be challenging, because it may interact harmfully with other medications. Additionally, the FDA advises against providing the treatment to those with severe kidney or liver impairment. Experts have also raised concerns about molnupiravir’s potential toxicities. It cannot be prescribed to minors and is not advised for pregnant women.

Chanapa Tantibanchachai, an FDA press officer, said the agency’s decision to forbid pharmacists from prescribing Paxlovid and molnupiravir “was based on several factors, including the drugs’ side effect profiles, the need to assess potential for drug interactions, the need to assess potential kidney function problems (including the severity of potential problems), and the need to evaluate patients for pre-existing conditions” linked to severe Covid-19. . .

> On 4 March, the American Medical Association said the “pharmacy based clinic component of the Test to Treat plan flaunts patient safety and risks significant negative health outcomes”. The AMA argued that by prescribing Covid antivirals at such clinics, providers may endanger patients for whom they lack a comprehensive medical history. . .

“Pharmacists spend their whole education focused on medications and their impacts on the body; whereas physicians take the minimal number of classes on pharmacology.” . .

Reference: https://www.theguardian.com/world/2022/mar/14/covid-biden-new-covid-initiative-wont-work-pharmacists


AMERICAN PRE-BUNKING (Jake Sullivan) ...COUNTER-BUNKING BY CHINA | Aljazeera

Here we go again! Weaponizing Social Media

Russia seeking military aid from China, says US official

Beijing rejects the US assertions as ‘disinformation’, as senior US and Chinese officials set to meet in Rome.

A United States official says Russia has asked China for military equipment to use in its invasion of Ukraine, a request that heightened tensions about the ongoing war before a meeting between senior US and Chinese officials in Rome.

In advance of the talks on Monday, White House NSA Jake Sullivan bluntly warned China to avoid helping Russia evade punishment from global sanctions that have hammered the Russian economy.

“We will not allow that to go forward,” he said.

The White House said the talks in the Italian capital will focus on the direct effect of Russia’s war against Ukraine on regional and global security.

A US official, speaking on condition of anonymity, said in recent days, Russia had requested support from China – including military equipment – to press forward in its ongoing war with Ukraine. The official did not provide details on the scope of the request. The request was first reported by the Financial Times and The Washington Post newspapers.

But Beijing on Monday accused Washington of spreading “disinformation” over China’s role in the Ukraine war.

Without directly addressing the US media reports of a Russian request for help from Beijing, foreign ministry spokesman Zhao Lijian said: “The US has been spreading disinformation targeting China on the Ukraine issue, with malicious intentions.”

Einar Tangen, senior international fellow at the Taihe Institute, a China-based think-tank, told Al Jazeera Beijing was not interested in providing military support.

“China has already said it quite clearly that they oppose the West putting more arms and ammunition into Ukraine as they see it as adding oil to fire. So it would be hypocritical if they were to start helping Russia,” Tangen said.

“In terms of economics, nothing has changed,” he said. “From China’s perspective, the US has in essence engineered a tragedy [and] the Russians have also been at fault by invading another country. But when you get down to it, two wrongs do not make a right,” added Tangen, noting that China was pushing for a diplomatic solution to the crisis.

Lifeline against Russia sanctions not ‘allowed’

Russia’s invasion of Ukraine has put China in a delicate spot with two of its biggest trading partners: the US and the European Union. China needs access to those markets, yet it has also shown support for Moscow, joining with Russia in declaring a friendship with “no limits”.

In his talks with senior Chinese foreign policy adviser Yang Jiechi, Sullivan will indeed be looking for limits in what Beijing will do for Moscow.

“I’m not going to sit here publicly and brandish threats,” he told CNN on Sunday. “But what I will tell you is we are communicating directly and privately to Beijing that there absolutely will be consequences” if China helps Russia “backfill” its losses from the sanctions.

“We will not allow that to go forward and allow there to be a lifeline to Russia from these economic sanctions from any country anywhere in the world,” Sullivan said.

In brief comments on the talks, Chinese Foreign Ministry spokesman Zhao Lijian did not mention Ukraine, saying the “key issue of this meeting is to implement the important consensus reached by the Chinese and US heads of state in their virtual summit in November last year”.

“They will exchange views on China-US relations and international and regional issues of common concern,” Zhao said in comments posted on the ministry’s website late on Sunday.

China-Russa cosy relations

China has been one of the few countries to avoid criticising the Russians for their invasion of Ukraine. China’s leader Xi Jinping hosted Putin for the opening of the Winter Olympics in Beijing just three weeks before Russia invaded on February 24.

During Putin’s visit, the two leaders issued a 5,000-word statement declaring limitless friendship.

China abstained on the United Nations votes censuring Russia and criticised economic sanctions against Moscow. It has expressed its support for peace talks and offered its services as a mediator, despite questions about its neutrality and scant experience mediating international conflict.

But questions remain over how far Beijing will go to alienate the West and put its own economy at risk. Sullivan said China and all countries are on notice that they cannot “basically bail Russia out … give Russia a workaround to the sanctions” with impunity.

Chinese officials have said Washington should not be able to complain about Russia’s actions because the US invaded Iraq under false pretences. The US claimed to have evidence Saddam Hussein was stockpiling weapons of mass destruction though none was ever found.

On CNN, Sullivan said the administration believes China knew that Putin “was planning something” before the invasion of Ukraine. But he said the Chinese government “may not have understood the full extent of it because it’s very possible that Putin lied to them the same way that he lied to Europeans and others.”

PANIC SELLING AND A PLUNGE | Bloomberg Markets


Panic Selling Grips Chinese Stocks in Biggest Plunge Since 2008

  • Rout has erased $2.1 trillion from China tech stocks from peak
  • Geopolitical risks saw U.S.-listed Chinese shares slump Friday
Video player cover image
China Tech Stocks Slide as Russia, Covid Concerns DeepenSource: Bloomberg

"Chinese stocks listed in Hong Kong had their worst day since the global financial crisis, as concerns over Beijing’s close relationship with Russia and renewed regulatory risks sparked panic selling.

The Hang Seng China Enterprises Index closed down 7.2% on Monday, the biggest drop since November 2008. The Hang Sang Tech Index tumbled 11% in its worst decline since the gauge was launched in July 2020, wiping out $2.1 trillion in value since a year-earlier peak

BEA News: U.S. International Trade in Goods and Services, January 2022

BEA logo and link to website

BEA News: U.S. International Trade in Goods and Services, January 2022
The U.S. monthly international trade deficit increased in January 2022 according to the U.S. Bureau of Economic Analysis and the U.S. Census Bureau. The deficit increased from $82.0 billion in December (revised) to $89.7 billion in January, as imports increased and exports decreased. The previously published December deficit was $80.7 billion. The goods deficit increased $7.1 billion in January to $108.9 billion. The services surplus decreased $0.6 billion in January to $19.2 billion.

Goods and Services Trade Deficit, Seasonally adjusted

The full text of the release on BEA's website can be found at: www.bea.gov/news/2022/us-international-trade-goods-and-services-january-2022

====

EMBARGOED UNTIL RELEASE AT 8:30 A.M. EST, Tuesday, March 8, 2022
CB 22–35
BEA 22–08

U.S. International Trade in Goods and Services, January 2022

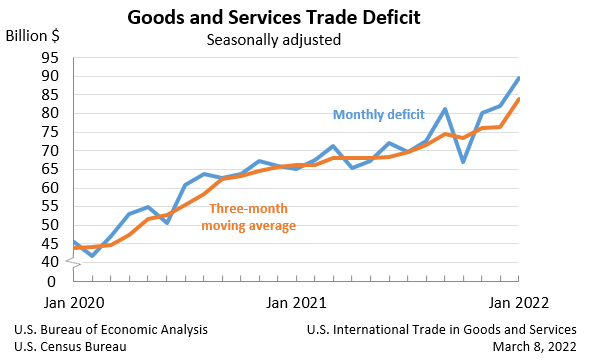
The U.S. Census Bureau and the U.S. Bureau of Economic Analysis announced today that the goods and services deficit was $89.7 billion in January, up $7.7 billion from $82.0 billion in December, revised.

U.S. International Trade in Goods and Services Deficit
Deficit:

$89.7 Billion

+9.4%°

Exports:

$224.4 Billion

-1.7%°

Imports:

$314.1 Billion

+1.2%°

Next release: Tuesday, April 5, 2022

(°) Statistical significance is not applicable or not measurable. Data adjusted for seasonality but not price changes

Source: U.S. Census Bureau, U.S. Bureau of Economic Analysis; U.S. International Trade in Goods and Services, March 8, 2022

Goods and Services Trade Deficit, Seasonally adjusted

Exports, Imports, and Balance (exhibit 1)

January exports were $224.4 billion, $3.9 billion less than December exports. January imports were $314.1 billion, $3.8 billion more than December imports.

The January increase in the goods and services deficit reflected an increase in the goods deficit of $7.1 billion to $108.9 billion and a decrease in the services surplus of $0.6 billion to $19.2 billion.

Year-over-year, the goods and services deficit increased $24.6 billion, or 37.7 percent, from January 2021.

Exports increased $29.9 billion or 15.4 percent.
Imports increased $54.4 billion or 21.0 percent.

COVID-19 Impact on International Trade in Goods and Services

The global pandemic and the economic recovery continued to impact international trade in January 2022. The full economic effects of the pandemic cannot be quantified in the statistics because the impacts are generally embedded in source data and cannot be separately identified.

Three-Month Moving Averages (exhibit 2)

The average goods and services deficit increased $7.6 billion to $83.9 billion for the three months ending in January.

  • Average exports decreased $0.1 billion to $225.9 billion in January.
  • Average imports increased $7.5 billion to $309.8 billion in January.

Year-over-year, the average goods and services deficit increased $17.8 billion from the three months ending in January 2021.

  • Average exports increased $35.7 billion from January 2021.
  • Average imports increased $53.6 billion from January 2021.

Exports (exhibits 3, 6, and 7)

Exports of goods decreased $2.3 billion to $155.9 billion in January.

   Exports of goods on a Census basis decreased $2.3 billion.

  • Consumer goods decreased $3.0 billion.
    • Pharmaceutical preparations decreased $3.2 billion.
  • Capital goods increased $1.1 billion.
    • Civilian aircraft increased $0.4 billion.
    • Telecommunications equipment increased $0.2 billion.

   Net balance of payments adjustments decreased less than $0.1 billion.

Exports of services decreased $1.6 billion to $68.5 billion in January.

  • Travel decreased $1.8 billion.
  • Transport decreased $0.5 billion.
  • Other business services increased $0.3 billion.
  • Financial services increased $0.2 billion.

Imports (exhibits 4, 6, and 8)

Imports of goods increased $4.8 billion to $264.8 billion in January.

   Imports of goods on a Census basis increased $4.6 billion.

  • Automotive vehicles, parts, and engines increased $1.6 billion.
    • Passenger cars increased $0.8 billion.
    • Other automotive parts and accessories increased $0.5 billion.
  • Industrial supplies and materials increased $1.5 billion.
    • Crude oil increased $0.9 billion.
    • Natural gas increased $0.6 billion.
    • Copper increased $0.6 billion.
  • Foods, feeds, and beverages increased $1.4 billion.
    • Other foods increased $0.5 billion.
    • Meat products increased $0.2 billion.
  • Capital goods increased $1.1 billion.
    • Telecommunications equipment increased $0.3 billion.
    • Other industrial machinery increased $0.3 billion.
    • Semiconductors decreased $0.6 billion.
  • Other goods decreased $1.6 billion.

   Net balance of payments adjustments increased $0.2 billion.

Imports of services decreased $1.0 billion to $49.3 billion in January.

  • Transport decreased $0.8 billion.
  • Travel decreased $0.5 billion.
  • Other business services increased $0.1 billion.

Real Goods in 2012 Dollars – Census Basis (exhibit 11)

The real goods deficit increased $6.4 billion to $118.1 billion in January.

  • Real exports of goods decreased $6.0 billion to $147.2 billion.
  • Real imports of goods increased $0.4 billion to $265.3 billion.

Revisions

Exports and imports of goods and services were revised for July through December 2021 to incorporate more comprehensive and updated quarterly and monthly data. In addition to these revisions, seasonally adjusted data for all months of 2021 were revised so that the totals of the seasonally adjusted months equal the annual totals.

Revisions to December exports

  • Exports of goods were revised down $0.1 billion.
  • Exports of services were revised up $0.3 billion.

Revisions to December imports

  • Imports of goods were revised up $0.3 billion.
  • Imports of services were revised up $1.2 billion.

Goods by Selected Countries and Areas: Monthly – Census Basis (exhibit 19)

The January figures show surpluses, in billions of dollars, with South and Central America ($4.4), Hong Kong ($2.0), Singapore ($1.3), Brazil ($1.1), and United Kingdom ($1.0). Deficits were recorded, in billions of dollars, with China ($33.3), European Union ($18.0), Mexico ($12.5), Japan ($7.1), Canada ($6.8), Germany ($5.4), Taiwan ($3.9), Italy ($3.2), South Korea ($3.0), India ($2.4), Saudi Arabia ($0.8), and France ($0.8).

  • The deficit with Canada increased $2.6 billion to $6.8 billion in January. Exports decreased $1.2 billion to $27.7 billion and imports increased $1.4 billion to $34.5 billion.
  • The deficit with Japan increased $2.1 billion to $7.1 billion in January. Exports increased $0.1 billion to $6.2 billion and imports increased $2.2 billion to $13.4 billion.
  • The deficit with India decreased $1.5 billion to $2.4 billion in January. Exports increased $0.6 billion to $4.3 billion and imports decreased $0.9 billion to $6.7 billion.

Goods and Services by Selected Countries and Areas: Quarterly – Balance of Payments Basis

Statistics on trade in goods and services by country and area are only available quarterly, with a one-month lag. With this release, fourth-quarter figures are now available.

The fourth-quarter figures show surpluses, in billions of dollars, with South and Central America ($22.1), Hong Kong ($6.7), Brazil ($6.4), Singapore ($5.1), United Kingdom ($5.0), and Saudi Arabia ($0.7). Deficits were recorded, in billions of dollars, with China ($87.9), European Union ($39.4), Mexico ($33.5), Germany ($18.4), India ($13.8), Taiwan ($11.9), Japan ($11.4), Italy ($10.5), Canada ($8.5), South Korea ($6.7), and France ($4.6).

  • The deficit with China increased $8.4 billion to $87.9 billion in the fourth quarter. Exports increased $2.8 billion to $48.0 billion and imports increased $11.2 billion to $136.0 billion.
  • The deficit with Mexico increased $8.3 billion to $33.5 billion in the fourth quarter. Exports increased $1.8 billion to $79.5 billion and imports increased $10.1 billion to $113.0 billion.
  • The deficit with Japan decreased $4.5 billion to $11.4 billion in the fourth quarter. Exports increased $1.6 billion to $28.9 billion and imports decreased $2.8 billion to $40.4 billion.

*             *             *

All statistics referenced are seasonally adjusted; statistics are on a balance of payments basis unless otherwise specified. Additional statistics, including not seasonally adjusted statistics and details for goods on a Census basis, are available in exhibits 1-20b of this release. For information on data sources, definitions, and revision procedures, see the explanatory notes in this release. The full release can be found at www.census.gov/foreign-trade/Press-Release/current_press_release/index.html or www.bea.gov/data/intl-trade-investment/international-trade-goods-and-services. The full schedule is available in the Census Bureau’s Economic Briefing Room at www.census.gov/economic-indicators/ or on BEA’s website at www.bea.gov/news/schedule.

*             *             *

Next release: April 5, 2022, at 8:30 A.M. EDT
U.S. International Trade in Goods and Services, February 2022

*             *             *

Notice

Changes to End-Use Classifications

With this release of the “U.S. International Trade in Goods and Services” report (FT-900), the U.S. Census Bureau and the U.S. Bureau of Economic Analysis (BEA) have revised the end-use classifications of several commodities. These changes were made to achieve a consistent classification between goods exports and goods imports and to improve the grouping of the commodities based on their end-use characteristics. The changes also reflect the results of work performed by the World Customs Organization (WCO) as part of its long-term program to review and update the nomenclature of the international Harmonized Commodity Description and Coding System (Harmonized System) from which the end-use commodity classifications are derived. The last WCO modifications to the Harmonized System were introduced in March 2017 with January 2017 statistics. These reclassifications will also be incorporated into statistics for 2019–2021 with the June 8, 2022, releases of the FT-900 and the FT-900 Annual Revision.

Additional Country Detail

With the releases of the FT-900 and the FT-900 Annual Revision on June 8, 2022, exhibits that present seasonally adjusted trade in goods and services by selected countries and areas—exhibits 19, 20, 20a, and 20b in the FT-900 and related exhibits 18, 19, 19a, and 19b in the FT-900 Annual Revision—will be expanded to include Australia, Belgium, Ireland, Israel, Malaysia, Netherlands, Switzerland, and Vietnam. Historical statistics will also be made available with the releases. In addition, exhibits 14 and 14a in the FT-900, which present not seasonally adjusted trade in goods by selected countries and areas, will be expanded to include Israel and Vietnam. Templates of the modified exhibits are available at www.census.gov/foreign-trade/statistics/notices/country_detail_templates.xlsx.

Upcoming Updates to Goods and Services

With the releases of the FT-900 and the FT-900 Annual Revision on June 8, 2022, statistics on trade in goods on both a Census basis and a balance of payments (BOP) basis will be revised beginning with 2017, and statistics on trade in services will be revised beginning with 2015. The revised statistics for goods on a BOP basis and for services will also be included in the “U.S. International Transactions, First Quarter 2022 and Annual Update” report and in the international transactions interactive database, both to be released by BEA on June 23, 2022.

Revised statistics on trade in goods will reflect:

  • Corrections and adjustments to previously published not seasonally adjusted statistics for goods on a Census basis.
  • End-use reclassifications of several commodities.
  • Recalculated seasonal and trading-day adjustments.
  • Newly available and revised source data on BOP adjustments, which are adjustments that BEA applies to goods on a Census basis to convert them to a BOP basis. See the “Goods (balance of payments basis)” section in the explanatory notes for more information.

Revised statistics on trade in services will reflect:

  • Newly available and revised source data, primarily from BEA surveys of international services, including the results of BEA’s benchmark survey of financial services.
  • Recalculated seasonal adjustments.
  • Revised temporal distributions of quarterly source data to monthly statistics. See the “Services” section in the explanatory notes for more information.

A preview of BEA’s 2022 annual update of the international transactions accounts will appear in the April 2022 Survey of Current Business.

If you have questions, please contact the Census Bureau, Economic Indicators Division, on (800) 549-0595, option 4, or at eid.international.trade.data@census.gov or BEA, Balance of Payments Division, at InternationalAccounts@bea.gov.

HOMELESSNESS: Million$$$$$$$ Spent on Fixing A Problem and It's Getting Worse, NOT Better

Intro: Here's an excellent example of Kicking-the-Can-Down-The-Road with a quotation from Hizzoner Mesa Mayor John Giles
“The Point in Time count underscores what we already know — homelessness is a critical issue for the Valley,” says Mesa Mayor John Giles, chair of the MAG Regional Council. “This is a regional challenge that needs regional solutions. These numbers are much more than statistics — they represent individuals, each with their own unique story. They are our neighbors, and our community. We all have a role to play in ensuring their access to safe, attainable housing.”

Maricopa Association of Governments News Release

FOR IMMEDIATE RELEASE CONTACT:

Kelly Taft   (602) 452-5020 or Nicky Stevens (602) 452-5006

Download as a PDF

Local Governments Work Together to Address Increase in Homelessness

January count finds continued rise in numbers across the region

PHOENIX (March 11, 2022) — The number of people experiencing homelessness continues to increase in communities across the region, with those living in unsheltered situations climbing by 35 percent since 2020, according to newly released numbers from the Maricopa Association of Governments (MAG). The numbers reflect a two-year increase, since the 2021 count was not conducted due to the COVID pandemic.

More than 5,000 people experienced homelessness in unsheltered situations in Maricopa County on the night of January 25, 2022. (See attachment for breakdown by jurisdiction.) Data collection and analysis from the shelter count conducted at the same time is underway. A full report with the results from the unsheltered and shelter counts, along with supplemental data, will more fully describe the full number of people experiencing homelessness. The report is pending additional data collection and analysis.

The number of people experiencing homelessness has continued to rise in recent years. Previous to the pandemic, the Maricopa County region experienced increases from 2014 to 2020, which is consistent with national trends. The pandemic strained economies worldwide, resulting in the loss of jobs, particularly low wage jobs. This placed people more at risk of experiencing homelessness.

While the stark rise in numbers is troubling, the increase was anticipated by local governments with a pulse on their communities. MAG member agencies have been working together for months to develop and implement a comprehensive regional approach to homelessness for the region. In December, the MAG Regional Council unanimously approved “Pathways Home, the Regional Homelessness Action Plan for Local and Tribal Governments,” the first regional homelessness plan created by local and tribal governments. A number of activities and investments are already underway to implement the Pathways Home plan and achieve progress.

“The Point in Time count underscores what we already know — homelessness is a critical issue for the Valley,” says Mesa Mayor John Giles, chair of the MAG Regional Council. “This is a regional challenge that needs regional solutions. These numbers are much more than statistics — they represent individuals, each with their own unique story. They are our neighbors, and our community. We all have a role to play in ensuring their access to safe, attainable housing.”

Riann Balch chairs the Maricopa Regional Continuum of Care Board, the regional group tasked with addressing homelessness in the region. Balch also serves as community development and resources manager for the city of Chandler.

“Rapidly changing market conditions and economic hardship heightened by the pandemic have created opportunities to work together across sectors and geography to address the housing crisis,” says Balch. “Housing is the foundation for healthy families and vibrant communities, and there are many new options to explore. This is an all-hands-on-deck kind of movement – we all have something to bring to the table.”

Coordinated by the Maricopa Association of Governments (MAG), the count uses volunteer teams that include city, county, and state representatives; community and faith-based organizations; businesses; and

private residents. It is designed as a one-day snapshot and different methodologies may impact results over time. The last count, conducted in 2020, found a one-year increase of 18 percent in unsheltered homelessness, consistent with the current two-year trend.

This year, the count was conducted entirely electronically via an app developed by MAG in 2018. The app was piloted in the past three PIT counts and has been refined to allow for more robust data analysis and high-quality accuracy. Conducting the count via the MAG app ensured a credible methodology that built on strengths of previous efforts. Conducting a paperless count enabled MAG to deduplicate the data in a more effective way and share unsheltered numbers earlier than previous years. MAG is still analyzing the data on trends involving subpopulations such as youth, veterans, and families to tell a more in-depth story of regional homelessness.

Want to help? Here are a few ways to get involved:

For additional information, contact:Communication DirectorKelly Taft

(602) 452-5020

ktaft@azmag.gov


THE COLORADO RIVER...Stolen by Law

Intro: 2 items with related content

1 High Country News Indian Country Newsletter

 A watercolor illustration of the Colorado River basin.

Gabriella Trujillo/High Country News

Indigenous nations have been an afterthought in U.S. water policy for over a century. That was all part of the plan.

By Pauly Denetclaw

The turbulent, choppy waters of the Colorado River pull from tributaries as far north as Wyoming before they race south for hundreds of miles, crashing together as they churn through the Grand Canyon, then smoothing out as they roll south. In southwestern Arizona, where the Sonoran and Mojave deserts meet, the river gently makes its way through Aha Makhav lands.

In the Mohave language, Aha Makhav means “the Water People.” The Mohave, Chemehuevi, Hopi and Navajo — the four tribes that comprise the Colorado River Indian Tribes, a federally recognized tribe that is also known as CRIT — have relied on floodplain and irrigated agriculture along the Colorado for 4,000 years. The CRIT Reservation was established in 1865 for the “Indians of the Colorado River and its tributaries.” (That vague language made it easier for the tribe to welcome people from the Hopi and Navajo nations in the ’40s.) Today, the reservation’s green, lush farmland stands out against the dry desert that surrounds it.


Read more

2

Tribes along the Colorado River navigate a stacked settlement process to claim their water rights

The result is that Indigenous nations face an unjust state of limbo


In early January, Lake Powell, a reservoir fed by the Colorado River, reached critically low levels. The bathtub ring around its receding edges has spent the last year gracing the pages of news publications across the nation, accompanied by increasingly panicked concern about Glen Canyon Dam’s hydropower turbines, which cannot operate reliably if the lake is lower than 3,490 feet. At the start of 2022, Powell’s water levels were just 46 feet above that threshold.

The drought is an emergency, and water cuts are coming. But the drought is also compounding another emergency. Indigenous nations within the river basin, left out of the 1922 Colorado River Compact, have been working through state and federal courts to settle their water rights, anticipating a situation like this. The settlement process takes time and money to resolve, however — resources that, like water, the drought saps daily. As is the case for the Rio Grande’s pueblos, tribes along the Colorado River without defined water rights still face a daunting colonial gantlet. Right now, the Navajo Nation and Hopi Tribe are working to quantify their rights in Arizona. The lengthy and costly adjudication process, in tandem with frequent legal opposition from private users and state and local governments, presents the two nations with a familiar choice between short-term concessions and a long-term gamble.

“We do believe a settlement of Hopi water claims is a forever sort of settlement, in the sense that it has to provide for a future permanent homeland for the Hopi people,” Fred Lomayesva, general counsel for the Hopi Tribe, said. “We see the need for water to be able to provide sufficient water for the future Hopi.”

For years now, Hopi communities in Upper Moenkopi and Kykotsmovi have banned heavy water users, like car washes and laundromats, in order to conserve groundwater from the N-aquifer, the primary water source for all of Hopi and a large swath of the Navajo Nation. But, as the laundromat ban shows, Hopi leaders have long recognized that the N-aquifer cannot meet their growing water needs. In 2004, then-Chairman Wayne Taylor Jr. said in a press release that in order to build a permanent homeland — the goal of Diné and Hopi leaders — they “must look outside our reservation.”

But the state of Arizona already had a plan to minimize the reach of the seven tribes that lacked settlements or decreed rights. In 2004, the same year as Taylor’s call to plan a future beyond the N-aquifer, the Arizona Water Settlements Act was passed by Congress thanks to the support of a bipartisan Arizona delegation. With a stroke of George W. Bush’s pen, the bill set a maximum annual quantity of 67,300 acre-feet for all future settlements between tribes and Arizona.

When reflecting on such a move, context matters. A settlement process skewed toward the state, through federal legislation, is the colonial process working as planned. As established in Infrastructure as Colonial Beachheads, a 2021 paper by Diné geographer and University of Arizona assistant professor Andrew Curley, the 2004 Arizona bill was only possible because the state was able to rapidly boost its population, and thus its strength in Congress, in the latter half of the 20th century. That growth was a direct result of the Interior Department’s decision in the 1960s to build the coal-powered Navajo Generating Station on Navajo lands in order to power the Central Arizona Project canal system. CAP then diverted Colorado River waters to the city of Phoenix, while the water-rights agreement devised by the federal government limited the Navajo Nation’s water claims for a half-century.

The decade following the Arizona bill’s passage was defined by failed settlement negotiations. In 2012, Sen. Jon Kyl introduced the Navajo-Hopi Little Colorado River Water Rights Settlement, but said he would not advance the bill without approval from both tribes. After an initially decisive “No” vote, the Hopi Council narrowly flipped and supported the legislation by an 8-7 margin. The Navajo Nation Council, however, voted against it for a myriad of reasons, among them the fact that it would have continued leasing water to the since-shuttered Navajo Generating Station, waived future claims to the Little Colorado River, and failed to include $800 million in water infrastructure funding for western Navajo communities.

“The question comes up, ‘Well, exactly how much water do Navajos need, because they don’t use very much?’” Michelle Brown-Yazzie, assistant attorney general for the Navajo Nation Water Rights Unit, said. “We don’t have the ability to use very much, and when we do have water, we’re very conservative with it, because we don’t know when we’re going to get it again.”

Despite the recent failed negotiations, both the Navajo and Hopi governments are again open to considering a settlement. The drought and the pandemic have had an undeniable influence on those decisions. But it’s also tied to the length and unpredictability of the adjudication process. Consider: It has been six years since an Arizona Superior Court decided to separate the Hopi and Navajo cases into sub-proceedings. The Hopi’s closing arguments for that particular sub-proceeding wrapped in October 2021. And still, it could be another decade or more before the special master appointed to the case completes the necessary hydrographic survey reports and the Superior Court issues a final decree for all the shareholders. According to Brown-Yazzie, the Navajo Nation is scheduled to begin its sub-proceeding for the Little Colorado River Adjudication in 2023. That will continue for up to a year, followed by the next two phases in the process, which could likewise take over a decade to complete. . .

While it has reached a variety of fund- and project-based settlements in New Mexico and Utah, the Navajo Nation is still being forced to defend its water rights against appeals. . .

As for Arizona, the Navajo Nation and the Hopi Tribe have remained open to settlement talks, even engaging in meetings last April. But both Brown-Yazzie and Lomayesva reiterated that while the drought and the pandemic have increased the pressure for everyone to come to an agreement as soon as possible, there are certain lines that won’t be crossed.

“We think it is important to try to continue to negotiate with the parties,” Brown-Yazzie said. “Of course, the Navajo Nation is not going to accept a settlement that we don’t think is fair and reasonable.”

This story was originally published by High Country News on March 1, 2022. High Country News is an independent magazine dedicated to coverage of the Western U.S. Subscribe, get the enewsletter, and follow HCN on Facebook and Twitter.


NO CAPTAIN ONBOARD