|

|
Personal Income and Outlays, January 2026
Personal income increased $113.8 billion (0.4 percent at a monthly rate) in January, according to estimates released today by the U.S. Bureau of Economic Analysis. Disposable personal income (DPI)—personal income less personal current taxes—increased $219.9 billion (0.9 percent), and personal consumption expenditures (PCE) increased $81.1 billion (0.4 percent).
This report for January 2026, originally scheduled for February 26, 2026, was rescheduled due to the October–November 2025 government shutdown.
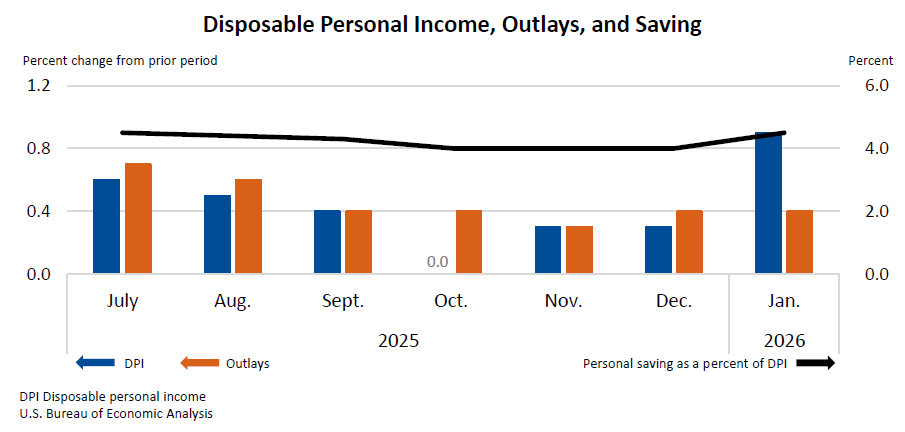
Personal outlays—the sum of PCE, personal interest payments, and personal current transfer payments—increased $85.8 billion in January. Personal saving was $1.05 trillion in January, and the personal saving rate—personal saving as a percentage of DPI—was 4.5 percent.
The increase in current-dollar personal income in January primarily reflected increases in compensation, personal dividend income, and personal current transfer receipts.
The $81.1 billion increase in current-dollar PCE in January reflected an increase of $105.7 billion in spending on services that was partly offset by a decrease of $24.6 billion in spending on goods.
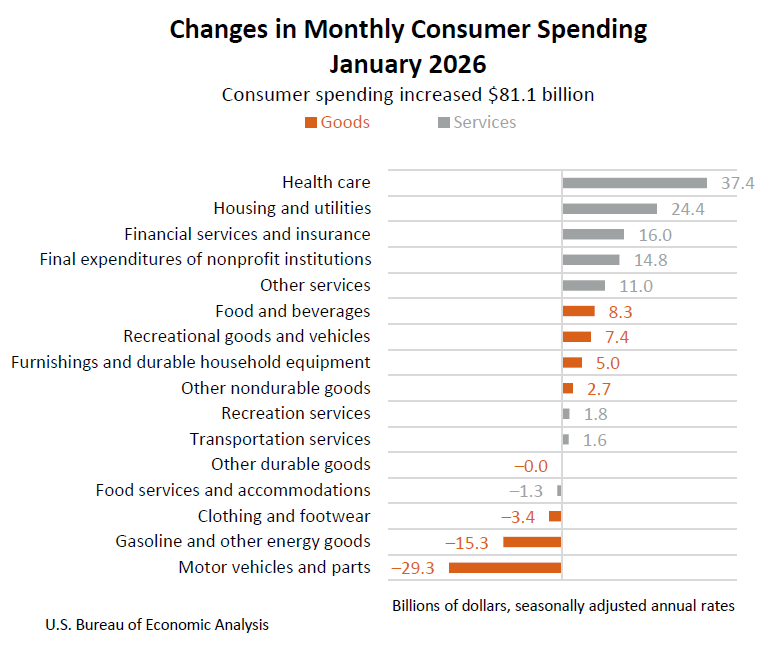
Real PCE increased $17.0 billion (0.1 percent at a monthly rate) in January.
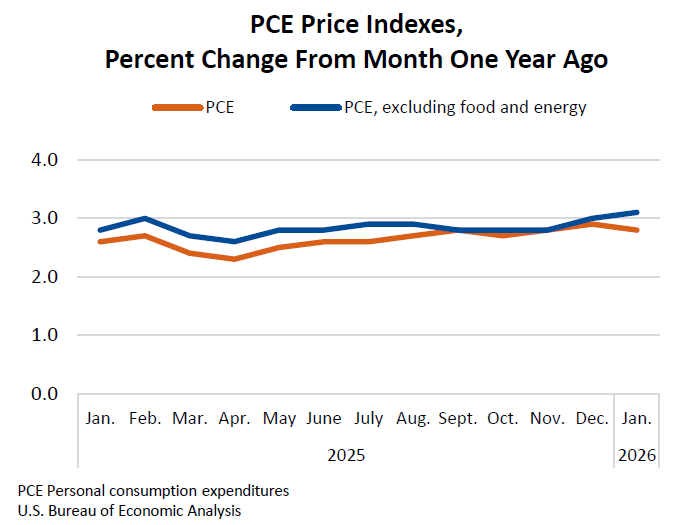
From the preceding month, the PCE price index for January increased 0.3 percent. Excluding food and energy, the PCE price index increased 0.4 percent.
From the same month one year ago, the PCE price index for January increased 2.8 percent. Excluding food and energy, the PCE price index increased 3.1 percent from one year ago.
| Personal Income and Related Measures [Percent change From preceding month] | ||||
|---|---|---|---|---|
| December | January | |||
| Current-dollar personal income | 0.3 | 0.4 | ||
| Current-dollar DPI | 0.3 | 0.9 | ||
| Real DPI | 0.0 | 0.7 | ||
| Current-dollar PCE | 0.4 | 0.4 | ||
| Real PCE | 0.1 | 0.1 | ||
| PCE price index | 0.4 | 0.3 | ||
| PCE price index, excluding food and energy | 0.4 | 0.4 | ||
Next release: April 9, 2026, at 8:30 a.m. EDT
Personal Income and Outlays, February 2026
Technical Notes
Changes in personal income and outlays for January
The January increase in personal income primarily reflected increases in compensation, personal dividend income, and personal current transfer receipts.
- Compensation increased $83.7 billion, primarily
reflecting an increase of $71.2 billion in wages and salaries, based on
U.S. Bureau of Labor Statistics (BLS) Current Employment Statistics
(CES) data.
- Private wages and salaries increased $67.5 billion, reflecting increases of $48.3 billion in services‑producing industries and $19.2 billion in goods-producing industries.
- Government wages and salaries increased $3.7 billion.
- Personal dividend income increased $44.6 billion, reflecting information from company financial statements.
- Personal current transfer receipts increased $18.0 billion, mainly reflecting an increase of $49.2 billion in social security benefits that was partly offset by a decrease of $16.7 billion in other government social benefits. The increase in social security benefits reflected a January cost-of-living adjustment based on data from the Social Security Administration. The decrease in other government social benefits reflected a decrease in estimated Affordable Care Act enrollments.
Revisions to personal income
Estimates have been updated for July through December. The estimates for July through September for compensation, personal taxes, and contributions for government social insurance reflect the incorporation of third-quarter wage and salary data from the BLS Quarterly Census of Employment and Wages program. The estimates for October through December reflect updated BLS CES data.
Related Data Tables
For the statistics highlighted in this release, as well as historical time series for these estimates, see the following data tables in BEA’s Interactive Data Application.
Table 2.6. Personal Income and Its Disposition
Table 2.8.1. Percent Change From Preceding Period in Real PCE by Major Type of Product
Table 2.8.5. PCE by Major Type of Product
Table 2.8.6. Real PCE by Major Type of Product
Table 2.8.7. Percent Change From Preceding Period in Prices for PCE by Major Type of Product
Table 2.8.11. Real PCE by Major Type of Product: Percent Change From Month One Year Ago
Note. With the next release of PIO, today’s data will be superseded, and the links above will reflect the latest data. The original data featured in this release can then be accessed in BEA’s Data Archive.


No comments:
Post a Comment