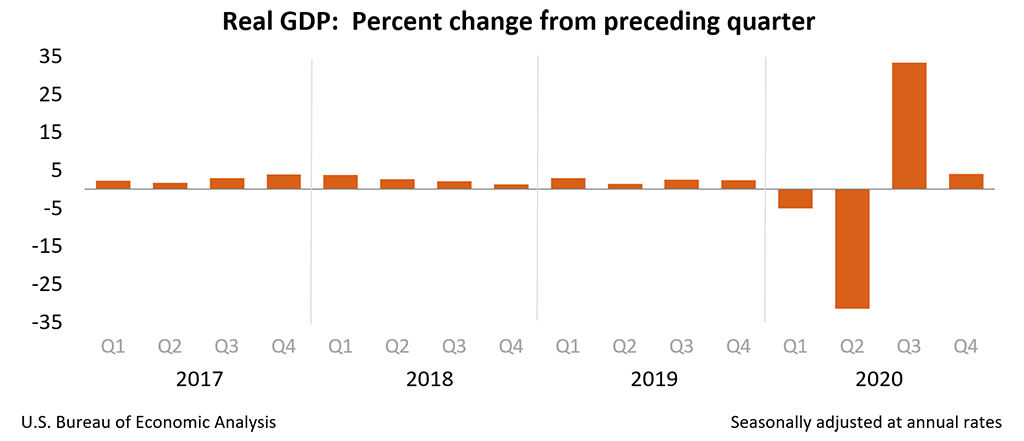
Real GDP: Percent change from preceding quarter, Q4 '20
Real GDP decreased 3.5 percent in 2020 (from the 2019 annual level to the 2020 annual level), compared with an increase of 2.2 percent in 2019 (table 1).
The decrease in real GDP in 2020 reflected decreases in PCE, exports, private inventory investment, nonresidential fixed investment, and state and local government that were partly offset by increases in federal government spending and residential fixed investment. Imports decreased (table 2).
The decrease in PCE in 2020 was more than accounted for by a decrease in services (led by food services and accommodations, health care, and recreation services). The decrease in exports reflected decreases in both services (led by travel) and goods (mainly non-automotive capital goods). The decrease in private inventory investment reflected widespread decreases led by retail trade (mainly motor vehicle dealers) and wholesale trade (mainly durable goods industries). The decrease in nonresidential fixed investment reflected decreases in structures (led by mining exploration, shafts, and wells) and equipment (led by transportation equipment) that were partly offset by an increase in intellectual property products (more than accounted for by software). The decrease in state and local government spending reflected a decrease in consumption expenditures (led by compensation).
The increase in federal government spending reflected an increase in nondefense consumption expenditures (led by an increase in purchases of intermediate services that supported the processing and administration of Paycheck Protection Program loan applications by banks on behalf of the federal government). The increase in residential fixed investment primarily reflected increases in improvements as well as brokers' commissions and other ownership transfer costs.
Current-dollar GDP decreased 2.3 percent, or $500.6 billion, in 2020 to a level of $20.93 trillion, compared with an increase of 4.0 percent, or $821.3 billion, in 2019 (tables 1 and 3).
NEW RELEASE
Real gross domestic product (GDP) increased at an annual rate of 4.0 percent in the fourth quarter of 2020 (table 1), according to the "advance" estimate released by the Bureau of Economic Analysis. In the third quarter, real GDP increased 33.4 percent.
> The GDP estimate released today is based on source data that are incomplete or subject to further revision by the source agency (see "Source Data for the Advance Estimate" on page 4). > The "second" estimate for the fourth quarter, based on more complete data, will be released on February 25, 2021.
The increase in real GDP reflected increases in exports, nonresidential fixed investment, personal consumption expenditures (PCE), residential fixed investment, and private inventory investment that were partly offset by decreases in state and local government spending and federal government spending. Imports, which are a subtraction in the calculation of GDP, increased (table 2).
The increase in exports primarily reflected an increase in goods (led by industrial supplies and materials).
The increase in nonresidential fixed investment reflected increases in all components, led by equipment.
The increase in PCE was more than accounted for by spending on services (led by health care); spending on goods decreased (led by food and beverages).
The increase in residential fixed investment primarily reflected investment in new single-family housing.
The increase in private inventory investment primarily reflected increases in manufacturing and in wholesale trade that were partly offset by a decrease in retail trade.
Current‑dollar GDP increased 6.0 percent at an annual rate, or $309.2 billion, in the fourth quarter to a level of $21.48 trillion.
> In the third quarter, GDP increased 38.3 percent, or $1.65 trillion (tables 1 and 3). More information on the source data that underlie the estimates is available in the Key Source and Data Assumptions file on BEA's website.
The price index for gross domestic purchases increased 1.7 percent in the fourth quarter, compared with an increase of 3.3 percent in the third quarter (table 4). The PCE price index increased 1.5 percent, compared with an increase of 3.7 percent in the third quarter. Excluding food and energy prices, the PCE price index increased 1.4 percent, compared with an increase of 3.4 percent.
Personal Income
Current-dollar personal income decreased $339.7 billion in the fourth quarter, compared with a decrease of $541.5 billion in the third quarter.
The decrease in personal income was more than accounted for by decreases in personal current transfer receipts (notably, government social benefits related to the winding down of CARES Act pandemic relief programs) and proprietors' income that were partly offset by increases in compensation and personal income receipts on assets (table 8).
Disposable personal income decreased $372.5 billion, or 8.1 percent, in the fourth quarter, compared with a decrease of $638.9 billion, or 13.2 percent, in the third quarter.
Real disposable personal income decreased 9.5 percent, compared with a decrease of 16.3 percent.
Personal saving was $2.33 trillion in the fourth quarter, compared with $2.83 trillion in the third quarter. The personal saving rate—personal saving as a percentage of disposable personal income—was 13.4 percent in the fourth quarter, compared with 16.0 percent in the third quarter. Additional information on factors impacting quarterly personal income and saving can be found in "Effects of Selected Federal Pandemic Response Programs on Personal Income."
GDP for 2020
Real GDP decreased 3.5 percent in 2020 (from the 2019 annual level to the 2020 annual level), compared with an increase of 2.2 percent in 2019 (table 1).
The decrease in real GDP in 2020 reflected decreases in PCE, exports, private inventory investment, nonresidential fixed investment, and state and local government that were partly offset by increases in federal government spending and residential fixed investment. Imports decreased (table 2).
The decrease in PCE in 2020 was more than accounted for by a decrease in services (led by food services and accommodations, health care, and recreation services). The decrease in exports reflected decreases in both services (led by travel) and goods (mainly non-automotive capital goods). The decrease in private inventory investment reflected widespread decreases led by retail trade (mainly motor vehicle dealers) and wholesale trade (mainly durable goods industries). The decrease in nonresidential fixed investment reflected decreases in structures (led by mining exploration, shafts, and wells) and equipment (led by transportation equipment) that were partly offset by an increase in intellectual property products (more than accounted for by software). The decrease in state and local government spending reflected a decrease in consumption expenditures (led by compensation).
The increase in federal government spending reflected an increase in nondefense consumption expenditures (led by an increase in purchases of intermediate services that supported the processing and administration of Paycheck Protection Program loan applications by banks on behalf of the federal government). The increase in residential fixed investment primarily reflected increases in improvements as well as brokers' commissions and other ownership transfer costs.
Current-dollar GDP decreased 2.3 percent, or $500.6 billion, in 2020 to a level of $20.93 trillion, compared with an increase of 4.0 percent, or $821.3 billion, in 2019 (tables 1 and 3).
The price index for gross domestic purchases increased 1.2 percent in 2020, compared with an increase of 1.6 percent in 2019 (table 4). The PCE price index also increased 1.2 percent in 2020, compared with an increase of 1.5 percent. Excluding food and energy prices, the PCE price index increased 1.4 percent, compared with an increase of 1.7 percent.
Measured from the fourth quarter of 2019 to the fourth quarter of 2020, real GDP decreased 2.5 percent during the period (table 6). That compared with an increase of 2.3 percent during 2019.
The price index for gross domestic purchases, as measured from the fourth quarter of 2019 to the fourth quarter of 2020, increased 1.3 percent during 2020. That compared with an increase of 1.4 percent during 2019. The PCE price index increased 1.2 percent, compared with an increase of 1.5 percent. Excluding food and energy, the PCE price index increased 1.4 percent, compared with an increase of 1.6 percent.
Source Data for the Advance Estimate
Information on the source data and key assumptions used for unavailable source data in the advance estimate is provided in a Technical Note that is posted with the news release on BEA's website. A detailed Key Source Data and Assumptions file is also posted for each release. For information on updates to GDP, see the "Additional Information" section that follows.
* * *
Next release, February 25, 2021 at 8:30 A.M. EST
Gross Domestic Product (Second Estimate) Fourth Quarter and Year 2020
* * *
| Release Dates in 2021 | ||||
|---|---|---|---|---|
| Estimate | 2020 Q4 and Year 2020 | 2021 Q1 | 2021 Q2 | 2021 Q3 |
| Gross Domestic Product | ||||
| Advance Estimate | January 28, 2021 | April 29, 2021 | July 29, 2021 | October 28, 2021 |
| Second Estimate | February 25, 2021 | May 27, 2021 | August 26, 2021 | November 24, 2021 |
| Third Estimate | March 25, 2021 | June 24, 2021 | September 30, 2021 | December 22, 2021 |
Gross Domestic Product by Industry | March 25, 2021 | June 24, 2021 | September 30, 2021 | December 22, 2021 |
| Corporate Profits | ||||
| Preliminary Estimate | --- | May 27, 2021 | August 26, 2021 | November 24, 2021 |
| Revised Estimate | March 25, 2021 | June 24, 2021 | September 30, 2021 | December 22, 2021 |


But video calls have something email doesn’t: eye contact. We feel more comfortable talking when our listeners’ eyes are visible because we can read their emotions and attitudes. This is especially important when we need more certainty—like when we meet a new team member or listen to a complex idea.
-----------------------------------------------------------------------------------------------------------------------------
| File #: | 21-0141 |
| Type: | Minutes | Status: | Agenda Ready |
| In control: | City Council |
| On agenda: | 2/8/2021 |
| Title: | Approval of minutes of previous meetings as written. |
| Attachments: |


| Meeting Name: | City Council | Agenda status: | Tentative |
| Meeting date/time: | 2/8/2021 5:45 PM | Minutes status: | Draft |
| Meeting location: | Virtual Platform | ||
| Published agenda: |  Agenda Agenda | Published minutes: | Not available | |
| Meeting video: |
| Attachments: |
|


