Wednesday, April 07, 2021
U.S. International Trade in Goods & Services for February 2021
News Release
BEA 21-17
U.S. International Trade in Goods and Services, February 2021
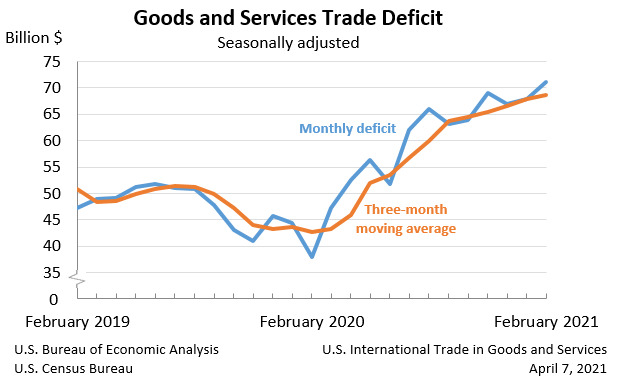
The U.S. Census Bureau and the U.S. Bureau of Economic Analysis announced today that the goods and services deficit was $71.1 billion in February, up $3.3 billion from $67.8 billion in January, revised.
| Deficit: | $71.1 Billion | +4.8%° |
| Exports: | $187.3 Billion | -2.6%° |
| Imports: | $258.3 Billion | -0.7%° |
Next release: Tuesday, May 4, 2021 (°) Statistical significance is not applicable or not measurable. Data adjusted for seasonality but not price changes Source: U.S. Census Bureau, U.S. Bureau of Economic Analysis; U.S. International Trade in Goods and Services, April 7, 2021 | ||
The global pandemic and the economic recovery continued to impact international trade in February 2021.
The full economic effects of the pandemic cannot be quantified in the statistics because the impacts are generally embedded in source data and cannot be separately identified.
Exports, Imports, and Balance (exhibit 1)
February exports were $187.3 billion, $5.0 billion less than January exports. February imports were $258.3 billion, $1.7 billion less than January imports.
The February increase in the goods and services deficit reflected an increase in the goods deficit of $2.8 billion to $88.0 billion and a decrease in the services surplus of $0.5 billion to $16.9 billion.
Year-to-date, the goods and services deficit increased $56.5 billion, or 68.6 percent, from the same period in 2020. Exports decreased $36.2 billion or 8.7 percent. Imports increased $20.3 billion or 4.1 percent.
Three-Month Moving Averages (exhibit 2)
The average goods and services deficit increased $0.7 billion to $68.6 billion for the three months ending in February.
- Average exports increased $1.1 billion to $189.9 billion in February.
- Average imports increased $1.8 billion to $258.5 billion in February.
Year-over-year, the average goods and services deficit increased $25.9 billion from the three months ending in February 2020.
- Average exports decreased $19.2 billion from February 2020.
- Average imports increased $6.7 billion from February 2020.
Exports (exhibits 3, 6, and 7)
Exports of goods decreased $4.8 billion to $131.1 billion in February.
Exports of goods on a Census basis decreased $4.8 billion.
- Capital goods decreased $2.5 billion.
- Other industrial machinery decreased $0.7 billion.
- Civilian aircraft decreased $0.5 billion.
- Semiconductors decreased $0.4 billion.
- Consumer goods decreased $0.9 billion.
- Foods, feeds, and beverages decreased $0.7 billion.
- Automotive vehicles, parts, and engines decreased $0.7 billion.
Net balance of payments adjustments increased $0.1 billion.
Exports of services decreased $0.2 billion to $56.1 billion in February.
- Travel decreased $0.1 billion.
Imports (exhibits 4, 6, and 8)
Imports of goods decreased $2.0 billion to $219.1 billion in February.
Imports of goods on a Census basis decreased $2.1 billion.
- Automotive vehicles, parts, and engines decreased $3.4 billion.
- Passenger cars decreased $1.8 billion.
- Consumer goods decreased $2.7 billion.
- Pharmaceutical preparations decreased $3.9 billion.
- Industrial supplies and materials increased $3.5 billion.
- Finished metal shapes increased $1.1 billion.
- Crude oil increased $1.0 billion.
- Natural gas increased $0.9 billion.
Net balance of payments adjustments increased $0.1 billion.
Imports of services increased $0.3 billion to $39.2 billion in February.
- Transport increased $0.2 billion.
- Insurance services increased $0.1 billion.
Real Goods in 2012 Dollars – Census Basis (exhibit 11)
The real goods deficit increased $3.0 billion to $99.1 billion in February.
- Real exports of goods decreased $7.9 billion to $139.4 billion.
- Real imports of goods decreased $4.9 billion to $238.5 billion.
Revisions
Revisions to January exports
- Exports of goods were revised up $0.2 billion.
- Exports of services were revised up $0.1 billion.
Revisions to January imports
- Imports of goods were revised up less than $0.1 billion.
- Imports of services were revised down $0.1 billion.
Goods by Selected Countries and Areas: Monthly – Census Basis
(exhibit 19)
The February figures show surpluses, in billions of dollars, with South and Central America ($3.7), Brazil ($1.4), Hong Kong ($1.2), Singapore ($0.6), United Kingdom ($0.2), and Saudi Arabia ($0.1). Deficits were recorded, in billions of dollars, with China ($30.3), European Union ($19.0), Mexico ($6.8), Germany ($5.3), Japan ($4.5), Canada ($4.0), Italy ($3.2), France ($2.7), Taiwan ($2.4), South Korea ($2.3), and India ($1.7).
- The deficit with China increased $3.1 billion to $30.3 billion in February. Exports decreased $4.5 billion to $10.4 billion and imports decreased $1.5 billion to $40.6 billion.
- The deficit with Canada increased $2.2 billion to $4.0 billion in February. Exports decreased $0.5 billion to $23.7 billion and imports increased $1.7 billion to $27.7 billion.
- The deficit with Mexico decreased $5.1 billion to $6.8 billion in February. Exports increased $2.1 billion to $22.8 billion and imports decreased $3.0 billion to $29.6 billion.
* * *
All statistics referenced are seasonally adjusted; statistics are on a balance of payments basis unless otherwise specified. Additional statistics, including not seasonally adjusted statistics and details for goods on a Census basis, are available in exhibits 1-20b of this release. For information on data sources, definitions, and revision procedures, see the explanatory notes in this release. The full release can be found at www.census.gov/foreign-
* * *
Next release: May 4, 2021, at 8:30 A.M. EDT
U.S. International Trade in Goods and Services, March 2021
* * *
Upcoming Updates to Goods and Services
With the releases of the “U.S. International Trade in Goods and Services, April 2021” report (FT-900) and the FT-900 Annual Revision on June 8, 2021, statistics on trade in goods on both a Census basis and a balance of payments (BOP) basis will be revised beginning with 2016, and statistics on trade in services will be revised beginning with 2013.
The revised statistics for goods on a BOP basis and for services will also be included in the “U.S. International Transactions, First Quarter 2021 and Annual Update” report and in the international transactions interactive database, both to be released by the U.S. Bureau of Economic Analysis (BEA) on June 23, 2021.
Revised statistics on trade in goods will reflect:
- Corrections and adjustments to previously published not seasonally adjusted statistics for goods on a Census basis.
- Incorporation of a new BOP adjustment to improve the coverage of aircraft imports on a BOP basis. For more information on BOP adjustments, which are adjustments that BEA applies to goods on a Census basis to convert them to a BOP basis, see the “Goods (balance of payments basis)” section in the explanatory notes.
- Newly available and revised source data on other BOP adjustments.
- Recalculated seasonal and trading-day adjustments.
Revised statistics on trade in services will reflect:
- Newly available and revised source data, primarily from BEA surveys of international services, including the results of BEA’s benchmark survey of insurance services.
- Recalculated seasonal adjustments.
- Revised temporal distributions of quarterly source data to monthly statistics. See the “Services” section in the explanatory notes for more information.
A preview of BEA’s 2021 annual update of the international transactions accounts will appear in the April 2021 issue of the Survey of Current Business.
If you have questions, please contact the U.S. Census Bureau, Economic Indicators Division, on (800) 549-0595, option 4, or ateid.international.trade.
HEADS UP > Mesa City Council "Study Session" Thu 08 April 2021
PLEASE TAKE A HARD LOOK and ASK THE RIGHT QUESTIONS

| File #: | 21-0395 |
| Type: | Presentation | Status: | Agenda Ready |
| In control: | City Council Study Session |
| On agenda: | 4/8/2021 |
| Title: | Hear a presentation, discuss, and provide direction on the following department budgets: |
| Attachments: | 1. Economic Development Presentation, 2. Fire and Medical Presentation |
- targeting key industries that provide high wage jobs and
- future sustainability for the community.
| File #: | 21-0427 |
| Type: | Minutes | Status: | Agenda Ready |
| In control: | City Council Study Session |
| On agenda: | 4/8/2021 |
| Title: | Housing and Community Development Advisory Board meeting held on March 4, 2021. |
| Attachments: | 1. Housing and Community Development Advisory Board Mar 4, 2021 |
Hooray for HUD > HUD Allocates Nearly $700 Million for Affordable Housing
Please make sure you open the link for state allocations (Arizona)
HUD NEWS
U.S. Department of Housing and Urban Development – Marcia L. Fudge, Secretary
Office of Public Affairs, Washington, DC 20410
HUD No. 21-053
HUD Public Affairs
202-708-0685
HUD Allocates Nearly $700 Million for Affordable Housing
Historic allocation through Housing Trust Fund will help states produce more affordable housing for extremely low- and very low-income households
WASHINGTON—The U.S. Department of Housing and Urban Development (HUD) on Tuesday announced the allocation of $689,565,492.92 through the nation’s Housing Trust Fund (HTF) for affordable housing. The Housing Trust Fund was launched in 2008 as an affordable housing production program that complements existing federal, state, and local efforts to increase and preserve the supply of decent, safe, and sanity affordable housing for low- and extremely low-income households, including families experiencing homelessness.
See here for list of state allocations.
“This past year has reminded us just how important it is to have access to safe and stable housing. But too many Americans are struggling to keep or find an affordable home,” said Secretary Marcia L. Fudge
“We are excited to announce this historic funding allocation, which will enable states to expand and preserve affordable housing for our neighbors who need our support the most.”
The Housing Trust Fund is capitalized through the contributions made by Fannie Mae and Freddie Mac. This year’s allocation is a significant increase in funding from last year’s allocation of $322,564,267.66. This program is specifically focused on housing for some of our most vulnerable populations.
HUD annually allocates HTF funds by formula. A state must use at least 80 percent of each annual grant for rental housing; up to 10 percent for homeownership; and up to 10 percent for the grantee's reasonable administrative and planning costs.
> HTF funds may be used for the production or preservation of affordable housing through the acquisition, new construction, reconstruction, and/or rehabilitation of non-luxury housing with suitable amenities. All HTF-assisted units will be required to have a minimum affordability period of 30 years. The Housing Trust Fund has supported the construction or rehabilitation of 775 rental units nationally since the first were allocated in 2017. There are currently 480 additional projects under construction. This year’s funding is expected to produce more than 5,400 additional affordable units.
###
HUD's mission is to create strong, sustainable, inclusive communities and quality affordable homes for all.
More information about HUD and its programs is available on the Internet
at www.hud.gov and http://

BEA News: U.S. International Transactions and Investment Position, 4th Quarter and Year 2025
BEA News: U.S. International Transactions and Investment Position, ...

-
 Flash News: Ukraine Intercepts Russian Kh-59 Cruise Missile Using US VAMPIRE Air Defense System Mounted on Boat. Ukrainian forces have made ...

