Monday, July 01, 2024

Today's Aerospace & Defense Headlines


 Jul 1, 2024

Norway Acquires New NASAMS Air Defence Systems

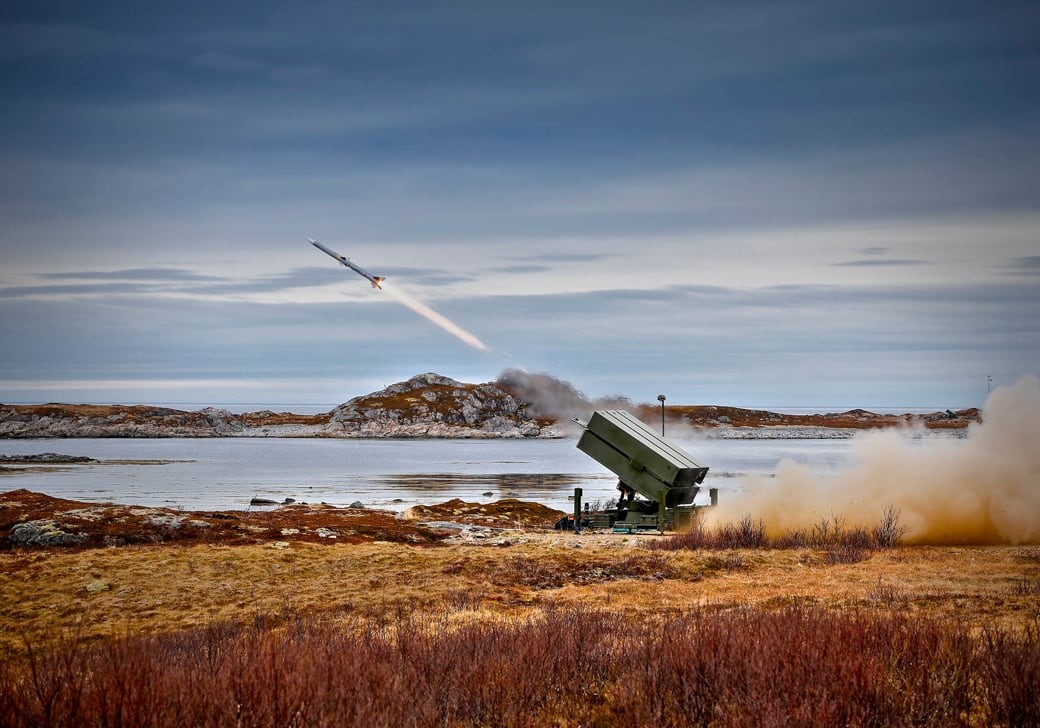
The Norwegian government has ordered new NASAMS air defence systems from Kongsberg Defence & Aerospace (KONGSBERG), which will strengthen the country’s defence capabilities to combat aerial threats. 
The contract has a value of up to approximately NOK 4.8 billion, including options, with expected deliveries from 2027.
  • The contract with the Norwegian Defence Material Agency includes new multi-missile canister launchers and new Fire Distribution Centers for NASAMS, replacing equipment previously donated to Ukraine.
Air defence is crucial for the defence of both Norway and Ukraine. We are now increasing volume and upgrading the existing NASAMS system with modern equipment capable of intercepting a variety of threats. The current security situation dictates that we must accelerate the development of air defence and the upgrade of NASAMS. This agreement ensures rapid delivery to the Armed Forces and contributes to increasing production capacity in the defence industry,” said Norway’s Defence Minister Bjørn Arild Gram
“A state-of-the-art air defence system is strategically important for Norway’s defence capabilities and is vital for safeguarding our national security interests. This delivery will provide Norway with the latest generation of NASAMS, developed to meet current and future threats,” said Eirik Lie, President of Kongsberg Defence & Aerospace.

The NOK 4.8 billion contract includes a fixed-price option worth NOK 2.5 billion for more air defense with validity until January 2025. Assuming parliamentary approval, the NDMA will thus have acquired four completely new NASAMS batteries within just one year.

“Actions are now being taken continuously to secure national interests by providing the Armed Forces with more and modern air defence systems as quickly as possible. This is, among others, a result of close collaboration between NDMA, KONGSBERG, and the defence industry in general.. It is characterized by excellent communication and great trust,” said Gro Jære, Director of the Norwegian Defence Material Agency.

About NASAMS
The original Norwegian Advanced Surface-to-Air Missile System, or NASAMS, was delivered to the Norwegian armed forces in the 1990s. Today there are currently 13 nations in the NASAMS user group.
NASAMS' modularity and open architecture enable the continuous introduction of new technology and new capability, which ensures that the system can be adapted to new threats and missions throughout its lifetime. NASAMS is one of the most flexible solutions in the market and covers a wide range of air defence needs.


Boeing to Acquire Spirit AeroSystems

THEY HAVE A PACKAGE FOR FINANCING IN THE NEXT 5 YEARS: Saudi Chip Ambitions Take Shape With New Hub

BEA News: U.S. International Investment Position, 1st Quarter 2024 and Annual Update


US Department of Commerce Bureau of Economic Analysis

BEA News: U.S. International Investment Position, 1st Quarter 2024 and Annual Update

The U.S. Bureau of Economic Analysis (BEA) has issued the following news release today:
The U.S. net international investment position, the difference between U.S. residents’ foreign financial assets and liabilities, was –$21.28 trillion at the end of the first quarter of 2024, according to statistics released today by BEA. 
  • Assets totaled $35.78 trillion, and liabilities were $57.06 trillion
  • At the end of the fourth quarter of 2023, the net investment position was –$19.85 trillion (revised).
The full text of the release can be found at www.bea.gov/news/2024/us-international-investment-position-1st-quarter-2024-and-annual-update.

U.S. International Investment Position, 1st Quarter 2024 and Annual Update

First Quarter

The U.S. net international investment position, the difference between U.S. residents’ foreign financial assets and liabilities, was –$21.28 trillion at the end of the first quarter of 2024, according to statistics released today by the Bureau of Economic Analysis (BEA) (chart 1). Assets totaled $35.78 trillion, and liabilities were $57.06 trillion (chart 2). 

  • At the end of the fourth quarter of 2023, the net investment position was –$19.85 trillion (revised). The net investment position and components of assets and liabilities are presented in table 1.
  • The –$1.43 trillion change in the net investment position from the fourth quarter of 2023 to the first quarter of 2024 came from net financial transactions of –$179.1 billion and net other changes in position, such as price and exchange-rate changes, of –$1.25 trillion (table 2).

Exchange-rate changes of –$592.1 billion reflected the depreciation of major foreign currencies against the U.S. dollar, which lowered the value of U.S. assets more than U.S. liabilities in dollar terms.

Price changes of –$565.5 billion reflected U.S. stock price increases that exceeded foreign stock price increases, which raised the market value of U.S. liabilities more than U.S. assets.

New Statistics
In this release, the U.S. Bureau of Economic Analysis (BEA) introduces new quarterly detail for “other changes in position” in U.S. assets and liabilities such as price, exchange-rate, and other changes in volume and valuation, for statistics beginning with the first quarter of 2023. 
Previously, this information was only available annually. 
These new statistics provide a more comprehensive and timely understanding of the United States’ financial interconnectedness with the rest of the world. 
The new quarterly detail will be published in this news release series every March, June, September, and December in table 2, which replaces table A included in previous news releases. 
Chart 1: U.S. Net International Investment Position: End of quarter, not seasonally adjusted
Chart 2: U.S. Assets and Liabilities: End of quarter, not seasonally adjusted

U.S. assets increased by $1.38 trillion to a total of $35.78 trillion at the end of the first quarter, driven mainly by foreign stock price increases that raised the market value of direct investment and portfolio investment assets (chart 3). 

The impact of stock price increases was partly offset by the depreciation of major foreign currencies against the U.S. dollar that lowered the value of foreign-currency-denominated assets in dollar terms.

Direct investment assets increased by $713.0 billion to $11.32 trillion and portfolio investment assets increased by $664.6 billion to $16.00 trillion, driven mainly by foreign stock price increases that raised the market value of these assets by $779.9 billion and $875.3 billion, respectively (table 2).

Chart 3: U.S. Assets by Category: End of quarter, not seasonally adjusted
Chart 4: U.S. Liabilities by Category: End of quarter, not seasonally adjusted

U.S. liabilities increased by $2.81 trillion to a total of $57.06 trillion at the end of the first quarter, driven by U.S. stock price increases that raised the market value of portfolio investment and direct investment liabilities (chart 4).

Portfolio investment liabilities increased by $1.58 trillion to $30.19 trillion and direct investment liabilities increased by $1.27 trillion to $16.08 trillion, driven mainly by U.S. stock price increases that raised the market value of these liabilities by $1.14 trillion and $1.20 trillion, respectively (table 2).


Annual Update of the U.S. International Investment Position Accounts

The statistics in this release reflect the annual update of the U.S. International Investment Position Accounts. With this update, BEA has incorporated newly available and revised source data for 2021–2023 (table 3).

In addition, BEA has incorporated a new methodology for estimating positions in other equity assets (a component of other investment assets), beginning with 2021. 

Revised positions reflect an initial yearend 2020 position brought forward by accumulating transactions (unrevised) and new estimates of exchange-rate changes for the foreign-currency-denominated equity positions of the U.S. government in the European Bank for Reconstruction and Development, the African Development Bank, and the African Development Fund.


Newly Available and Revised Source Data: Key Providers and Years Affected

AgencyDataYears affected
U.S. Bureau of Economic AnalysisBenchmark, annual, and quarterly direct investment surveys (direct investment and other investment assets and liabilities)2021–2023
U.S. Department of the TreasuryAggregate Holdings, Purchases and Sales, and Fair Value Changes of Long-Term Securities by U.S. and Foreign Residents (portfolio investment assets and liabilities)2022–2023
Foreign-Residents’ Holdings of U.S. Securities, including Selected Money Market Instruments (portfolio investment liabilities)2023
U.S. Ownership of Foreign Securities, including Selected Money Market Instruments (portfolio investment assets)2022
Reports by Financial Institutions of Liabilities to, and Claims on, Foreign Residents by U.S. Residents (portfolio investment and other investment assets and liabilities)2021–2023
Reports of Liabilities to, and Claims on, Unaffiliated Foreign Residents by U.S. Resident Non-Financial Institutions (portfolio investment and other investment assets and liabilities)2021–2023
Reports of Holdings of, and Transactions in, Financial Derivatives Contracts with Foreign Residents (financial derivatives assets and liabilities)None

More information on the annual update is available in “Preview of the 2024 Annual Update of the International Economic Accounts” in the Survey of Current Business, and additional information will be published in July in the Survey.


Next release: September 25, 2024, at 8:30 a.m. EDT

July 1 celebrations mark 27th anniversary of Hong Kong’s return to Chine...

Zelensky Calls for a European Army as He Slams EU Leaders’ Response

      Jan 23, 2026 During the EU Summit yesterday, the EU leaders ...