Climate Reanalyzer
began in early 2012 as a platform for visualizing climate and weather forecast models.
Site content
is organized into three general categories: Weather Forecasts, Climate Charts, and Research Tools.
Pages within the first two groups are the easiest to use and include maps, map animations, and
interactive time series charts (with data export options).
- Research Tools include pages for generating
custom maps, time series, and linear correlations from monthly climate reanalysis, gridded data,
and climate models.
- Content licensing and citation information, and the website disclaimer, are found
in the footer of each page (scroll or click
here).
Today's Weather Maps
Click Map to Change View

Page Overview & Data Sources
-
This page shows the current day's average weather for temperature, precipitation, wind, and other variables
forecasted by the
NOAA/NCEP Global Forecast System (GFS). GFS is a numerical modeling framework that uses a 13 km
Finite-Volume Cubed-Sphere dynamical core (FV3)
to produce
16-day forecasts four times each day. The weather maps here
show 1-day average conditions calculated from eight 3-hourly
GFS forecast timesclices beginning 0000 UTC. Sea ice
concentration is an analysis field produced daily by the
NCEP Environmental Monitoring Center. Sea surface temperature
is from a NOAA gridded data product described below. All weather and sea ice data are downloaded from the
NOAA Operational Model Archive and Data Distribution System (NOMADS).
Visualizations are made using NCAR Command Language.
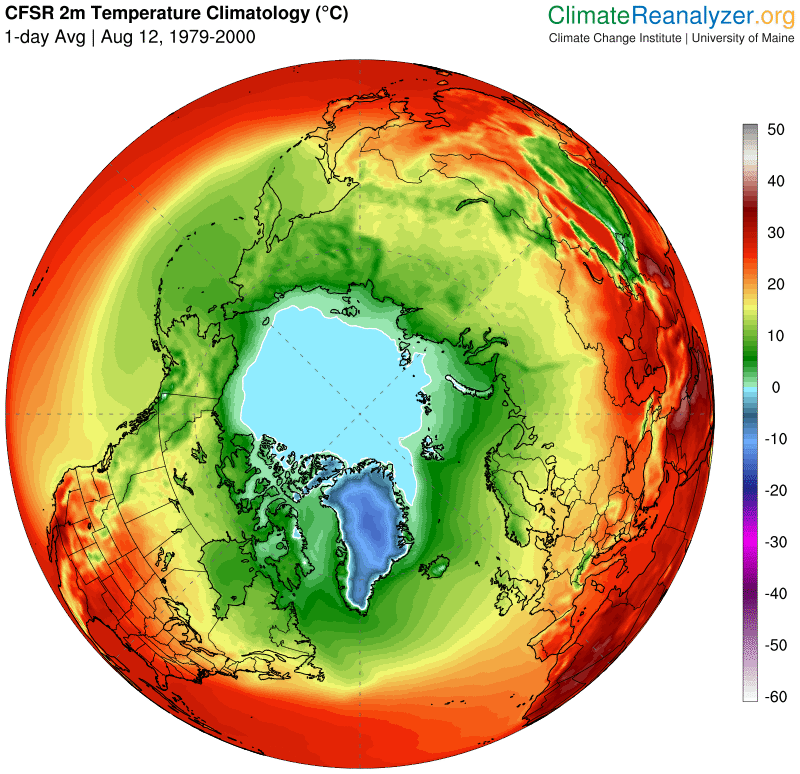
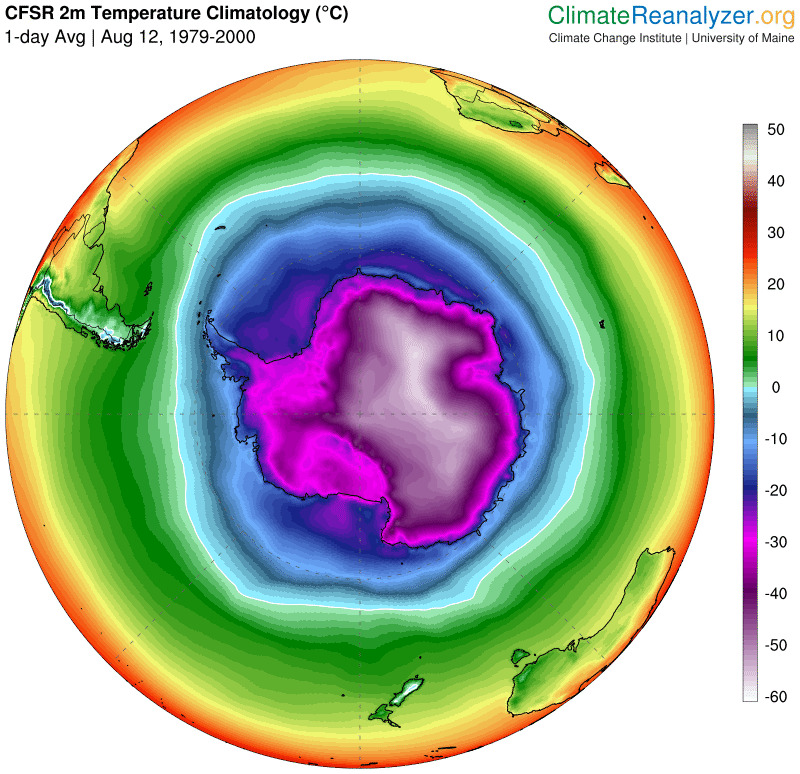
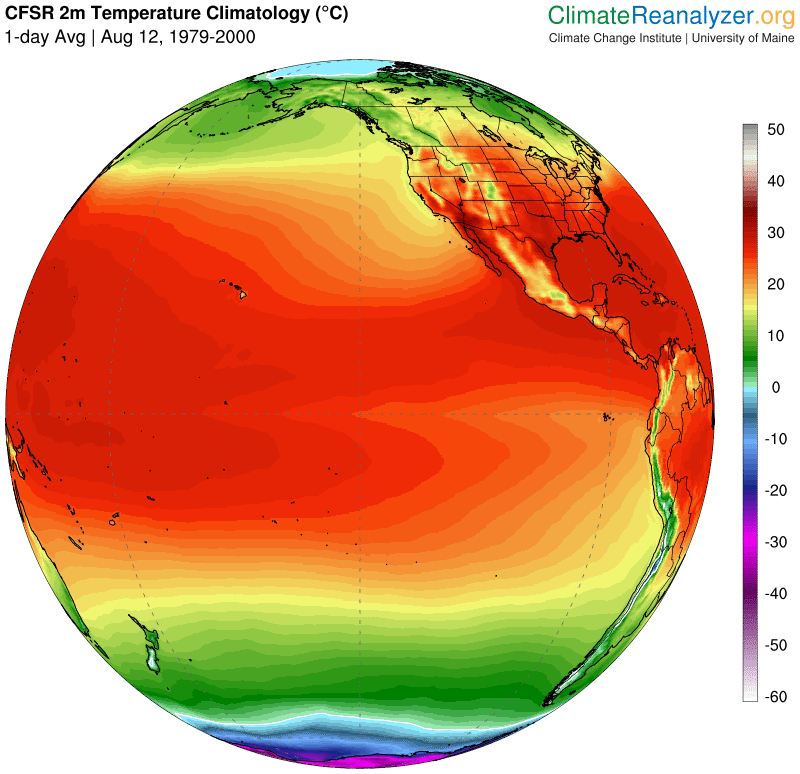
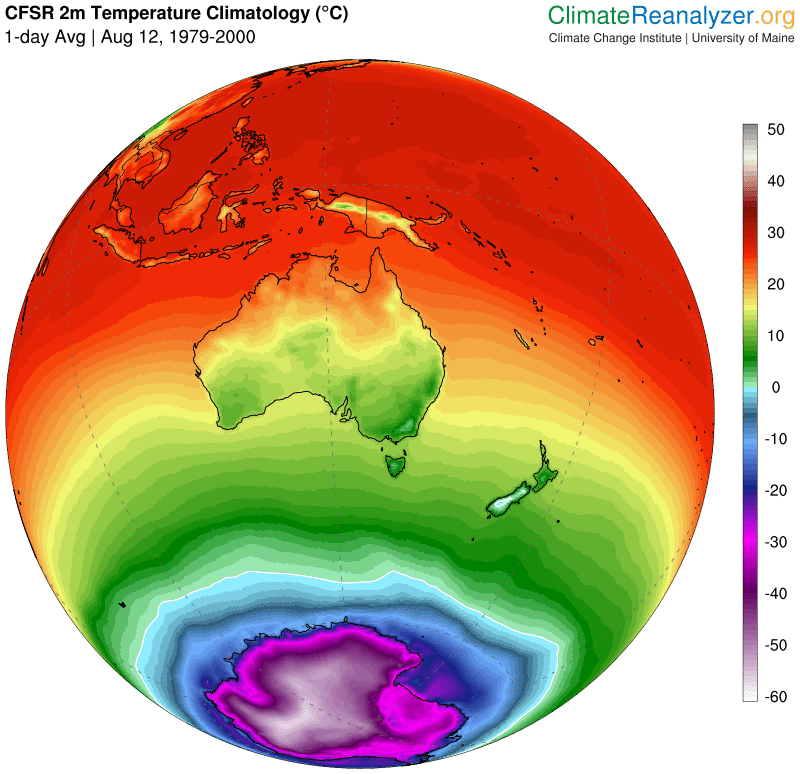
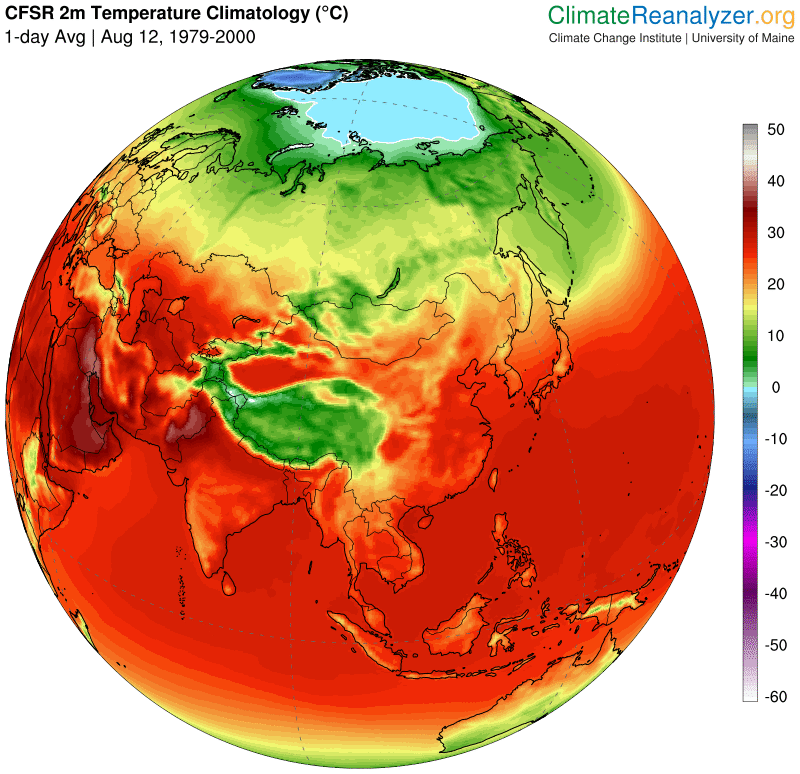
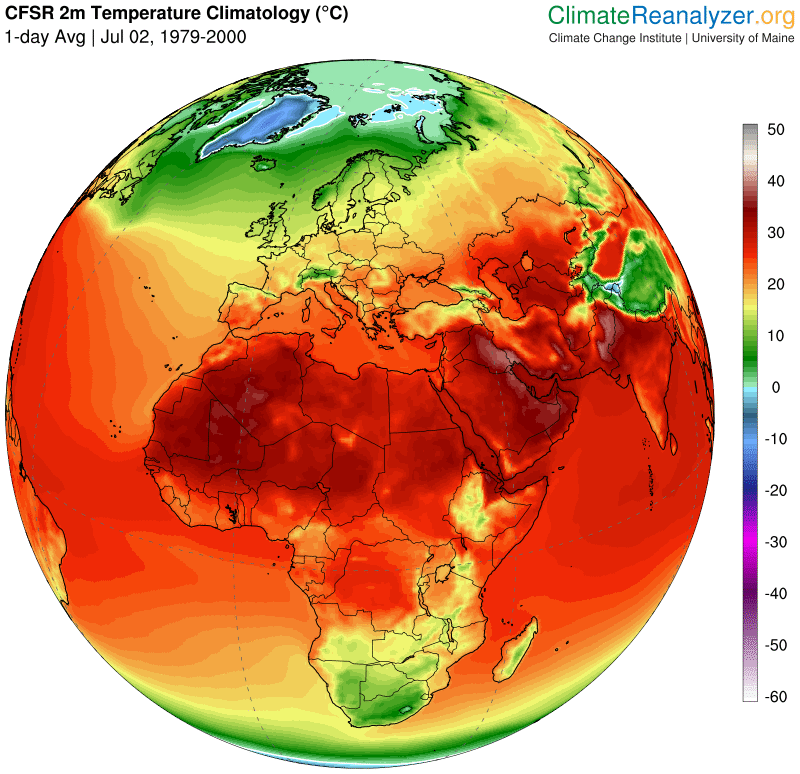
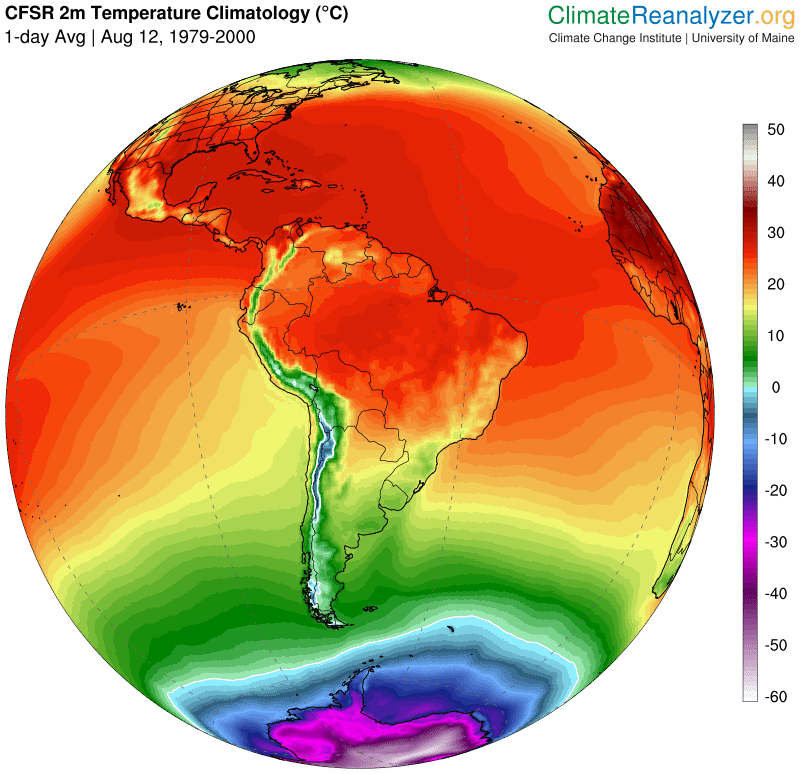
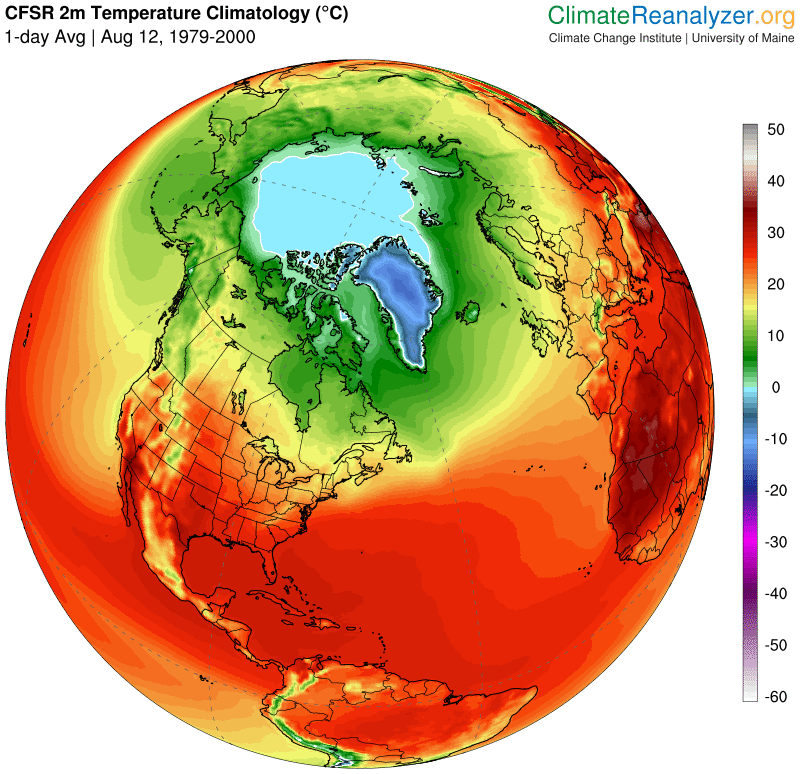
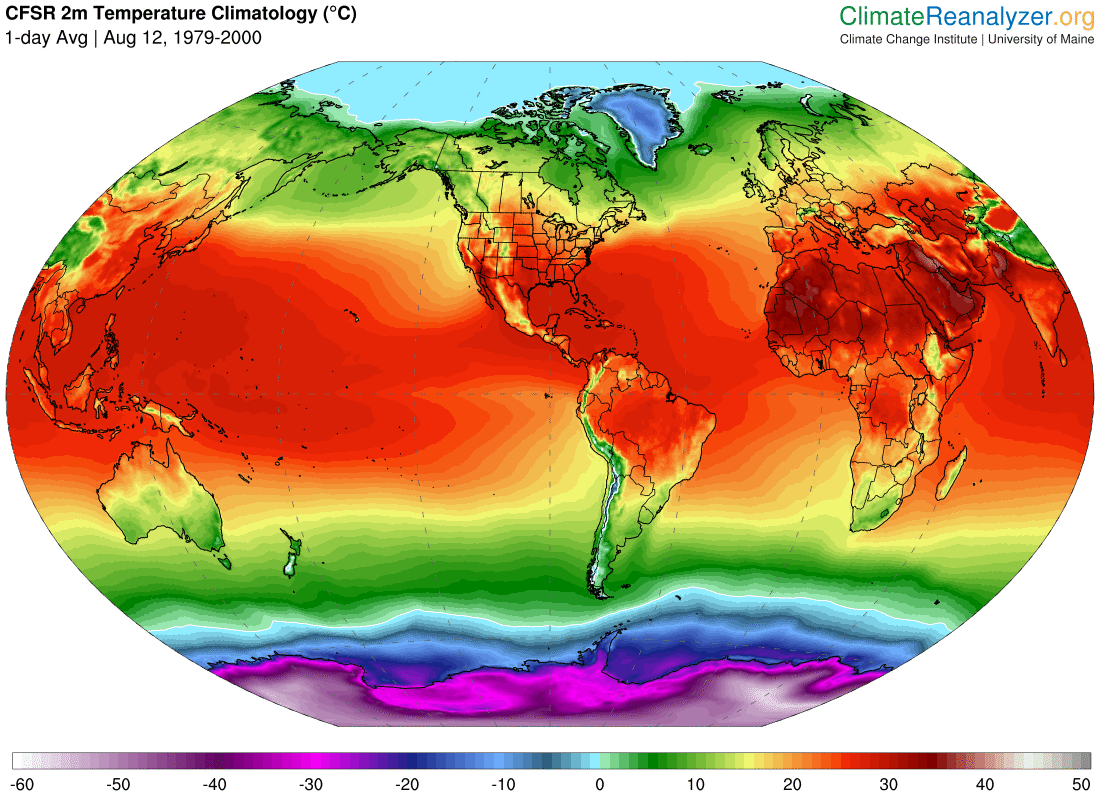
- 2m Temperature refers to air temperature at 2 meters above the surface. 2m Temperature Anomaly
refers to the departure of the current day's forecast
temperature from a long-term mean for the same day of the year. The
anomalies here are calculated from a 1979–2000 climatology from
the
NCEP Climate Forecast System Reanalysis (CFSR). This
22-year baseline, which is used instead a 30-year 1991–2020 climate
normal, represents the early part of the CFSR record prior to
significant warming observed across the Arctic since the early 2000s.
Users are encouraged to learn more about reanalysis — approach, strengths, limitations, and product
comparisons — from the
NCAR Climate Data Guide. Additional information about reanalysis can be found at
Advancing Reanalysis.
- Sea Surface Temperature (SST) and SST Anomaly maps are generated from
NOAA Optimum Interpolation SST (OISST).
OISST is a 0.25°x0.25° gridded dataset that estimates
temperatures based on a blend of satellite, ship, and buoy
observations. OISST also includes SST anomaly (based on a
1971–2000 NOAA climatology) and sea ice concentration variables.
A sea ice mask is applied to the SST and anomaly maps for
gridcells where ice concentration is >= 50%. Learn more about the
OISST, including strengths and limitations, from the
NCAR Climate Data Guide.
- Other variable definitions:
- Precipitable Water (PWtr) –
Total amount of water vapor in a column of air that could be precipitated.
- Mean Sea Level Pressure (MSLP) –
Atmospheric pressure as it would be observed at sea level.
- Geopotential Height
(GPH) –
Estimated physical height of a pressure surface in the
atmosphere, typically reported in decameters (dam) (1 dam = 10 meters).
- Standardized Anomaly
–
Climate anomaly divided by the climatological standard
deviation. Standardized (also called normalized) anomalies are
useful for comparing the magnitude of an event without the
effects of signal dispersion (such as the difference in
seasonal ranges). The units are standard deviations (σ) from
the mean of a
normal distribution. Values within
1σ account for about 68% of observations; about 95% for 2σ; and about 99.7% for 3σ. The latter
can be used as a general threshold for identifying extreme events.
- Looking for long-term climate trends? Climate Reanalyzer has pages for plotting
time series and
maps from reanalysis and gridded data
products. Or check out this page with
U.S. temperature and precipitation data since 1895. Also refer to NOAA's
Climate at a Glance for global temperature change since 1850.