2025 Guide to Interest Rates: Navigating the Price of Money
Understanding Cycles, Policy, and Market Impact
Recent
labor market prints point to normalizing growth, yet inflation remains
stubbornly above the Fed’s 2% target. Markets are now pricing in
significant rate cuts, raising the question: how do you navigate a world
where growth is normalizing but money is still expensive? Interest
rates are not an abstract policy lever—they define the cost of credit
and touch every part of the economy. From homeowners facing higher
mortgage payments to corporations refinancing debt, the ripple effects
are everywhere.
There is ALWAYS a tangible impact on the changes of interest rates across every person in the economy and financial system:
Homeowners — Mortgage costs rise and fall with rates, directly changing affordability.
Renters — Landlord borrowing costs pass through as higher rents.
Corporations — Debt refinancing and capital investment depend on the cost of credit.
Small Business Owners — Access to working capital tightens when rates climb.
Investors — Rates drive bond pricing, equity valuations, and cross-asset flows.
Governments — Servicing sovereign debt gets more expensive as rates rise.
Consumers — Credit cards, auto loans, and student debt all move with policy shifts.
Housing Market Participants — Construction and sales volumes hinge on mortgage affordability.
Retirees / Pension Funds — Rates shape income generation and portfolio stability.
If
you are reading this, it is likely because you fall into one of these
categories or because you are helping someone manage their interest rate
risk within them.
Homeowners
Strategy: Lock mortgages when spreads compress, refinance strategically, and avoid floating-rate loans in tightening cycles.
Why the regime matters:
In a falling-rate environment, refinancing can reduce payments
substantially. In a rising-rate regime, understanding forward guidance
helps avoid unaffordable exposure.
Renters
Strategy: Negotiate longer leases during easing cycles, and time moves when financing costs decline for landlords.
Why the regime matters: Anticipating rate shifts lets renters position ahead of rising rental costs rather than reacting after increases hit.
Corporations (CFOs, Treasurers)
Strategy: Extend maturities in low-rate regimes, hedge exposure to volatility, and delay large borrowing when rates are elevated.
Why the regime matters:
Knowing whether rates are peaking or cutting guides whether to lock
financing now or wait, directly influencing earnings and shareholder
value.
Small Business Owners
Strategy: Maintain liquidity buffers, secure fixed-rate credit during easing, and stagger debt maturity to weather volatility.
Why the regime matters: Rate cycles dictate whether capital access expands or contracts, shaping survival odds in downturns.
Investors
Strategy:
Shift allocation between bonds, equities, and alternatives depending on
curve shape and rate direction; exploit relative-value opportunities.
Why the regime matters:
Rates set the discount rate on all future cash flows—knowing the regime
prevents being caught on the wrong side of valuation compressions or
expansions.
Governments
Strategy: Smooth debt issuance across maturities, lock funding in low-rate environments, and manage rollover risk during tightening.
Why the regime matters: The interest rate regime dictates fiscal sustainability—misjudging it leads to spiraling deficits.
Consumers
Strategy:
Pay down floating-rate debt quickly in rising cycles, refinance fixed
obligations in easing cycles, and adjust consumption timing to financing
conditions.
Why the regime matters: Understanding where policy rates are headed avoids locking into unfavorable debt structures and maximizes disposable income.
Housing Market Participants (Builders, Realtors)
Strategy:
Align construction pipelines with periods of rate easing, offer
financing incentives when rates are high, and time sales cycles to
affordability trends.
Why the regime matters:
Housing demand is hyper-sensitive to mortgage rates; anticipating
policy direction avoids misaligned inventory and cash flow crises.
Retirees / Pension Funds
Strategy:
Rebalance toward higher-yielding instruments in rising cycles, ladder
maturities to smooth returns, and hedge volatility in transition
periods.
Why the regime matters:
Pension solvency and retirement income streams depend on forward rate
paths—misjudging them risks underfunding or eroded purchasing power.
If you can understand where we are in the interest rate cycle, you can understand how to adjust exposure.
Even if the future cannot be known with certainty, the present can be
mapped with precision and that clarity provides the strategy for what to
do right now.
Growth
in the U.S. economy remains resilient, with little evidence of
significant deterioration in the data. This resilience provides
structural support for long-end interest rates, anchoring them at higher
levels than in previous cycles. At the same time, inflation risk is not
elevated enough to push yields to new highs, keeping upward pressure
contained.
The Fed’s willingness to let significant cuts be
priced into the forward curve, combined with capital flowing out the
risk curve, signals that policy is shifting within a broader regime of
structurally higher rates. This means the key question for markets is
not whether rates are high, but how the path unfolds in the interim.
If
we can establish a clear understanding of that path, we can design a
clear strategy for how to adjust exposures and take action as we move
into the end of 2025.
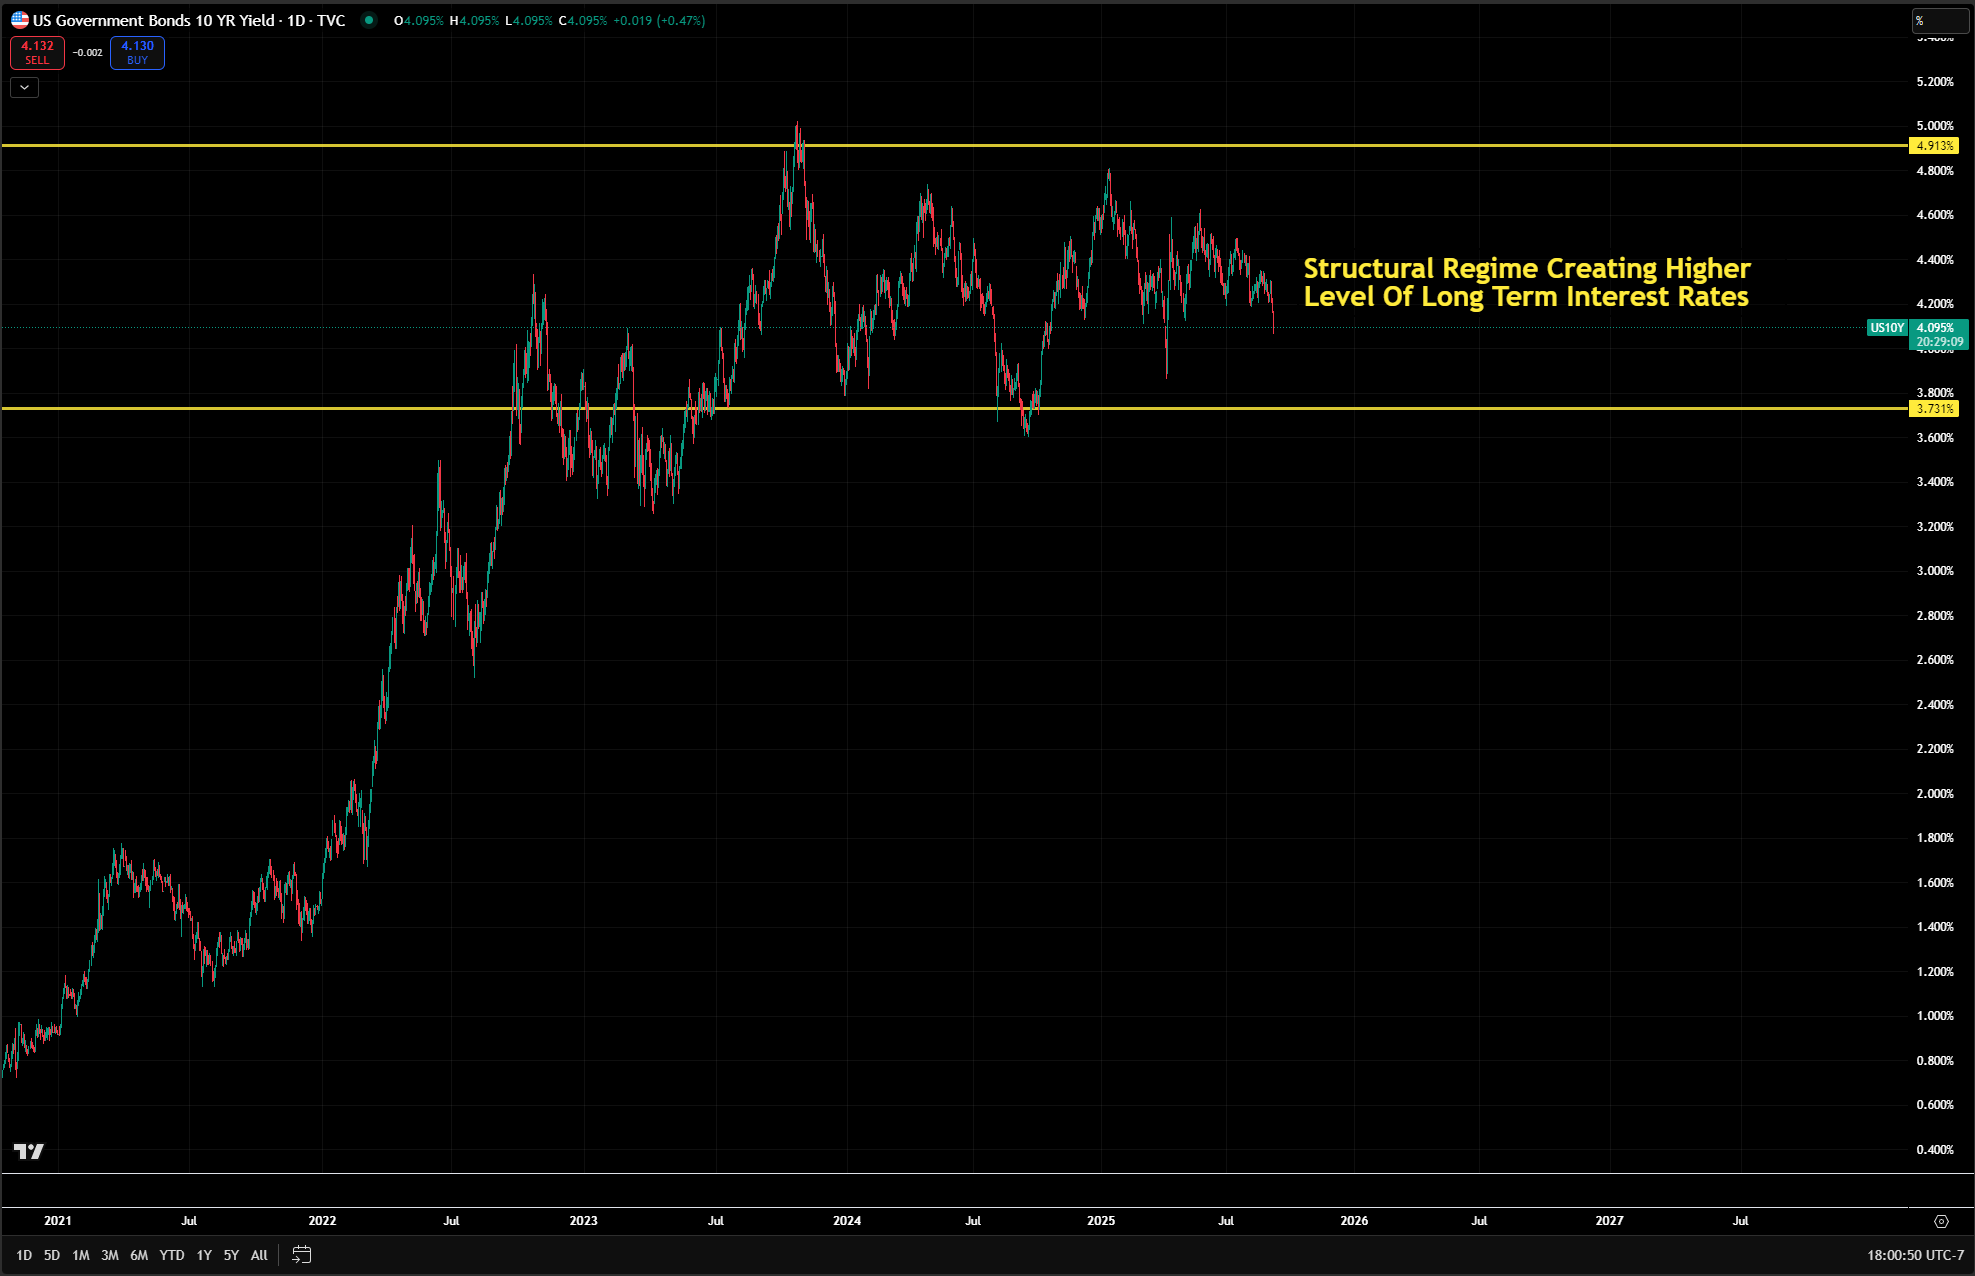
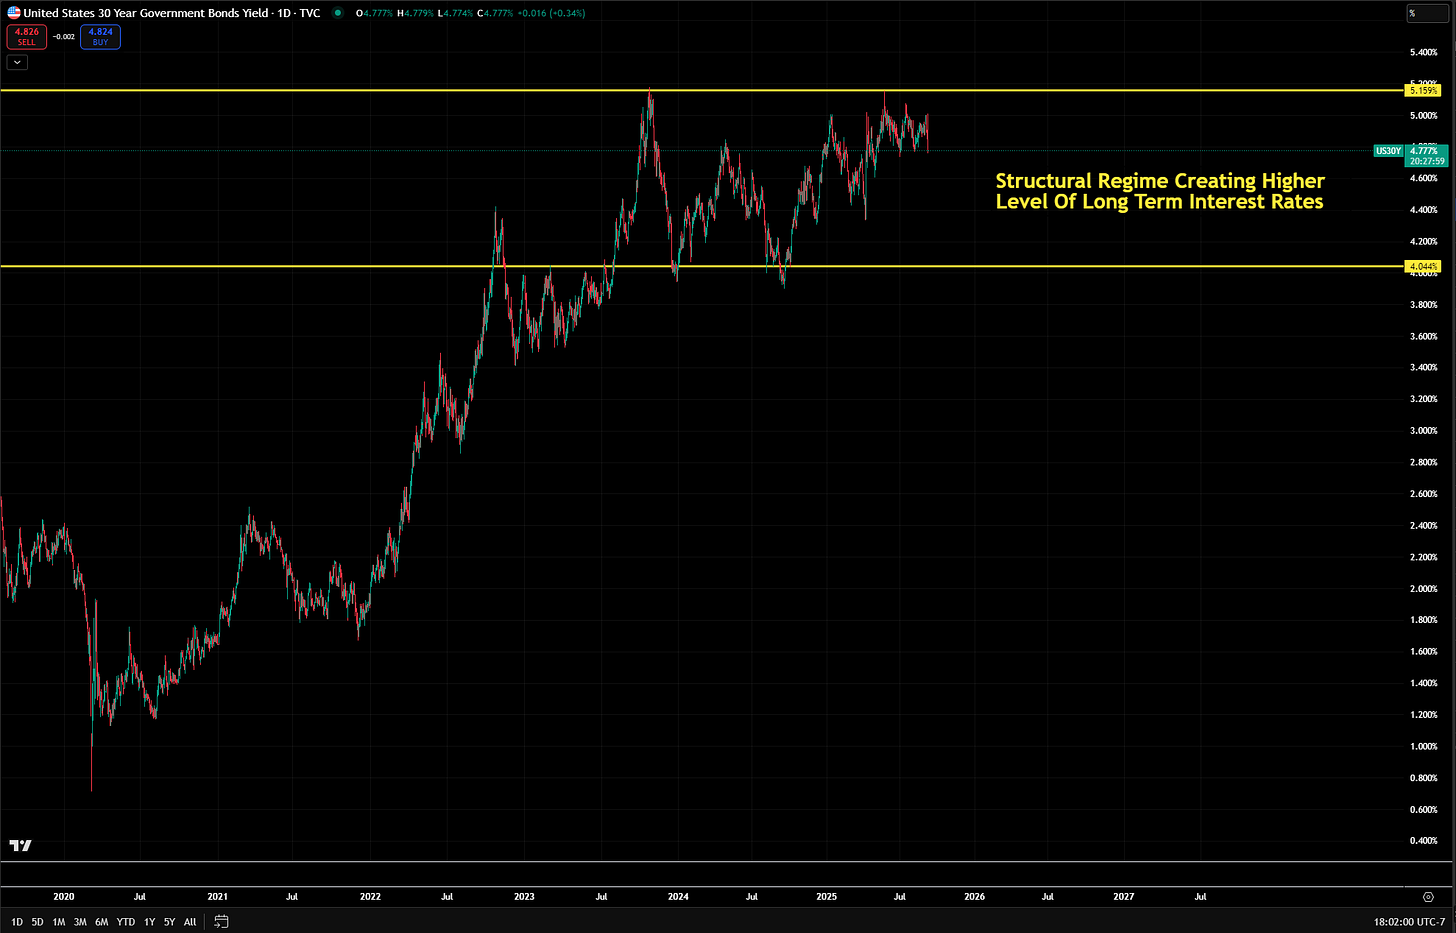
This structural reality is tangibly reflected in the longer term ranges we have seen in long end rates
10 year interest structural range:
30 year interest rate structural range:
When
long-term interest rates push toward the top of their structural range,
it reflects temporary inflation risks that fail to develop into a
sustained inflationary cycle. Conversely, when rates move toward the
bottom of the range, it reflects recession risks that ultimately do not
materialize into a full downturn.
Within
that backdrop, the path of rates is shaped by short-term catalysts that
act as intertemporal markers. These events are not just data
releases—they are checkpoints where the market tests whether the current
regime is holding or shifting. By mapping these catalysts, we can track
how inflation risk and recession risk express themselves inside the
broader structural ranges of long-term rates.
2025-09-10: PPI Inflation Print
2025-09-11: CPI Inflation Print
2025-09-17: FOMC Rate Decision and Forecasts
2025-09-25: PCE Inflation Print
2025-09-30: JOLTS Labor Report
2025-10-01: ADP Employment Report
2025-10-03: Nonfarm Payrolls (NFP)
2025-10-08: FOMC Rate Decision and Forecasts
2025-10-15: CPI Inflation Print
2025-10-16: PPI Inflation Print
2025-10-30: PCE Inflation Print
2025-11-04: JOLTS Labor Report
2025-11-05: ADP Employment Report
2025-11-07: Nonfarm Payrolls (NFP)
2025-11-13: CPI Inflation Print
2025-11-14: PPI Inflation Print
2025-11-19: FOMC Rate Decision and Forecasts
2025-11-26: PCE Inflation Print
2025-12-02: JOLTS Labor Report
2025-12-03: ADP Employment Report
2025-12-05: Nonfarm Payrolls (NFP)
2025-12-10: CPI Inflation Print
2025-12-10: FOMC Rate Decision and Forecasts
2025-12-11: PPI Inflation Print
2025-12-19: PCE Inflation Print
The
Trading Tactical Playbook for actively trading through these types of
catalysts is here (all of the other playbooks are linked in the
educational primer section below):

Us Interest Rates Trading Tactical Playbook (5)
788KB ∙ PDF file
My
macro view remains that the credit cycle is in full swing: inflation
risk is elevated, real rates are falling, and capital is moving out the
risk curve into higher-risk equity sectors. This dynamic will likely
continue until the surplus of liquidity becomes unsustainable. The most
probable trigger for unsustainability will be either long-end rates
blowing out to the upside or cross-border flows selling U.S. assets as
the Fed and Treasury continue to undermine the currency. I laid out how
this functions in the two most recent macro reports:
Until
one of these risks trigger, the primary goal is being long risk assets
that benefit from the credit cycle AND managing the path of interest
rates within this higher structural range.
The
recent labor market prints and rhetoric by the Fed directly connect to
specific ranges in the SOFR curve and long duration bonds. I am going to
walk you through them and explain HOW to think about WHERE interest
rates are likely to move.
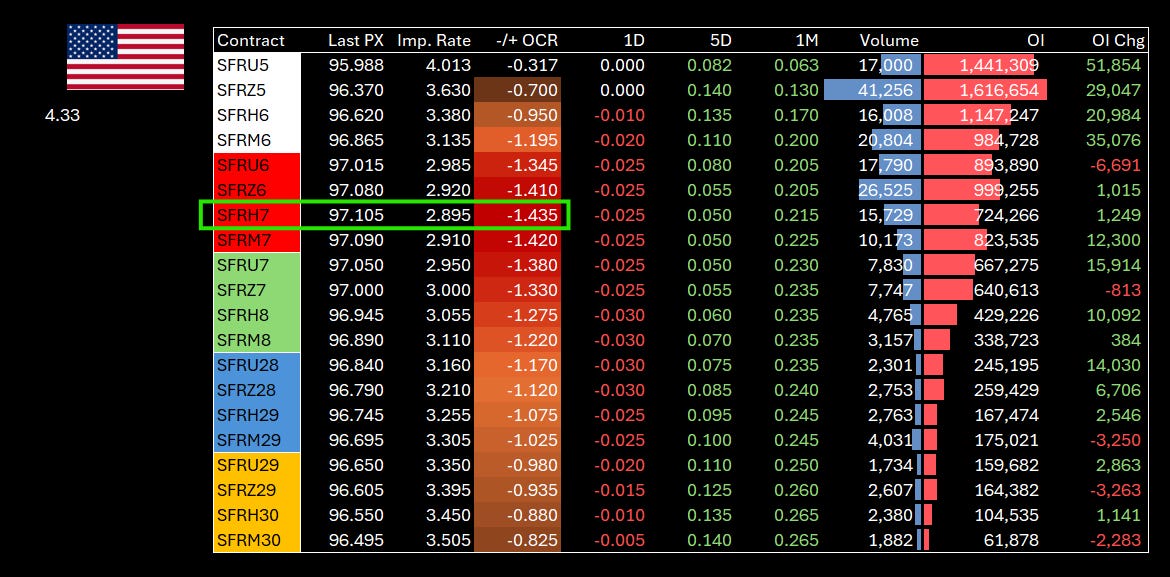
The model below breaks down HOW
AGGRESSIVELY the forward curve is pricing cuts. The H7 contract (March
2027) is where the deepest part of the cuts exists in the forward curve.
In simple terms, the forward curve is pricing a total of 143bps of cuts
between now and March of 2027.
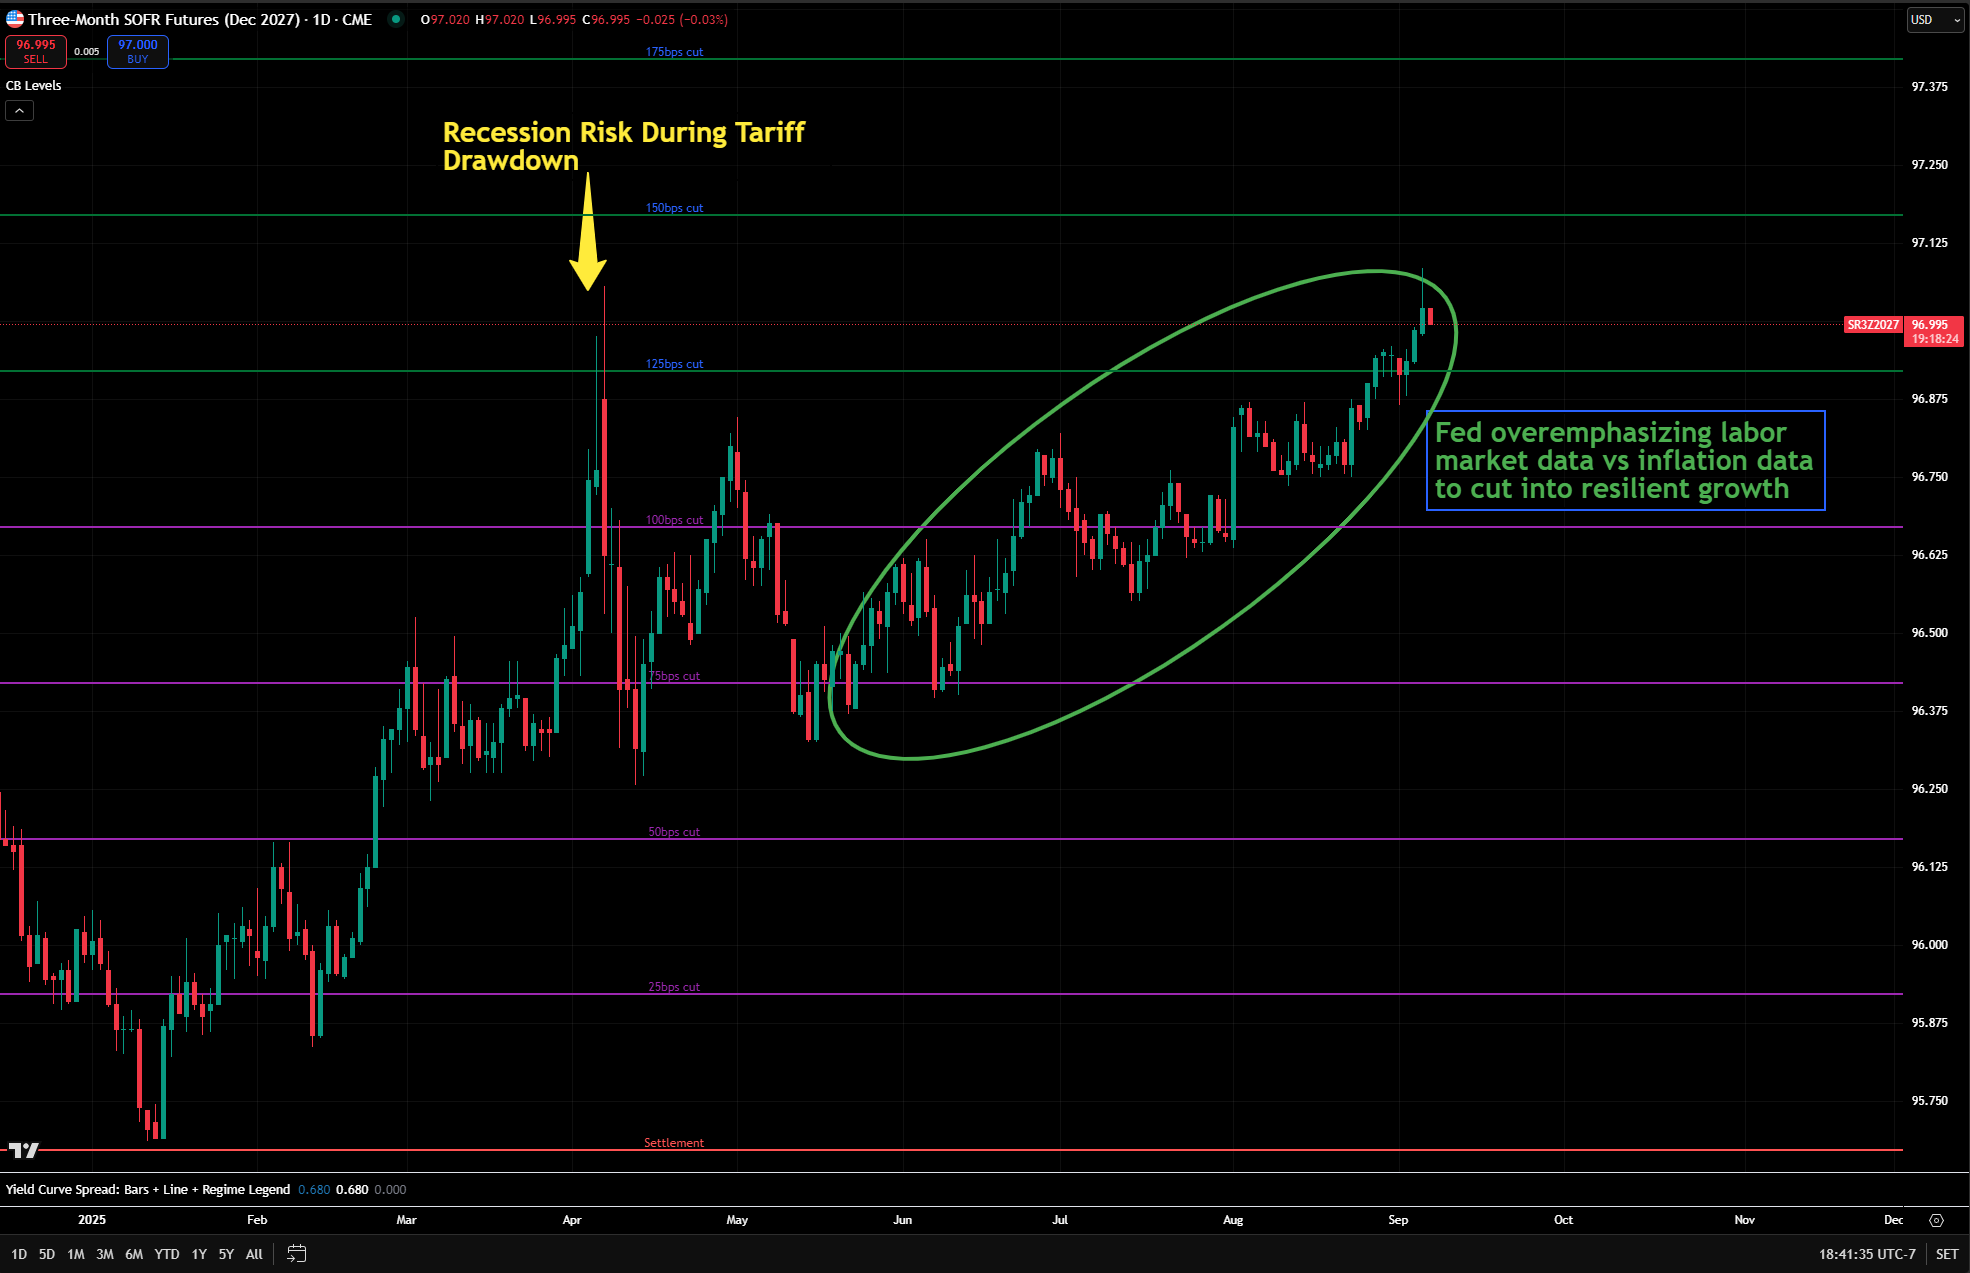
The
H7 contract priced the same aggressiveness of rate cuts earlier this
year during the tariff drawdown in equities. Since this time, the Fed
has allowed the reds (colored SOFR contracts in model above) price more
and more rate cuts on the forward curve.
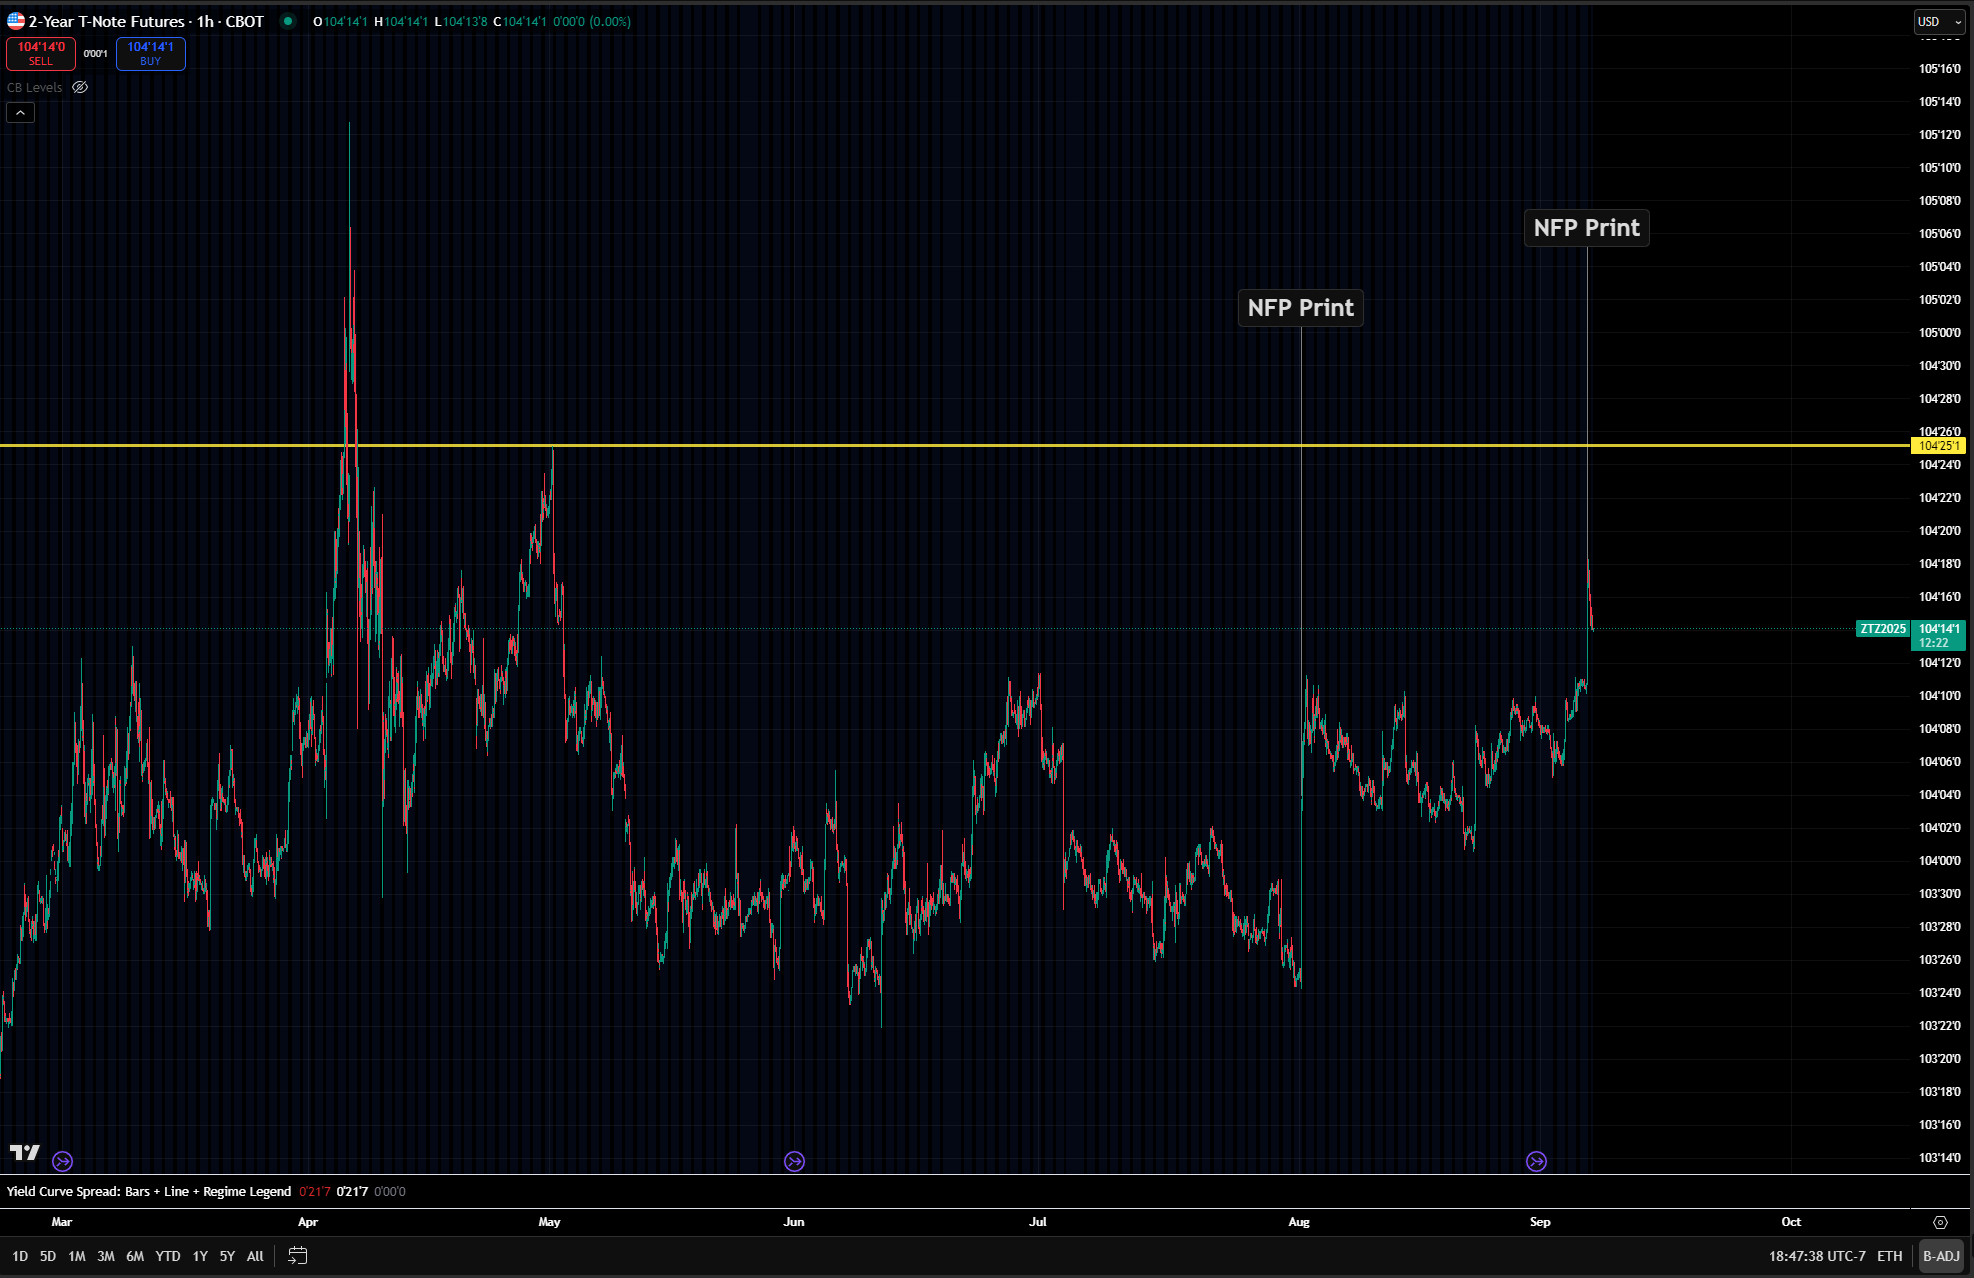
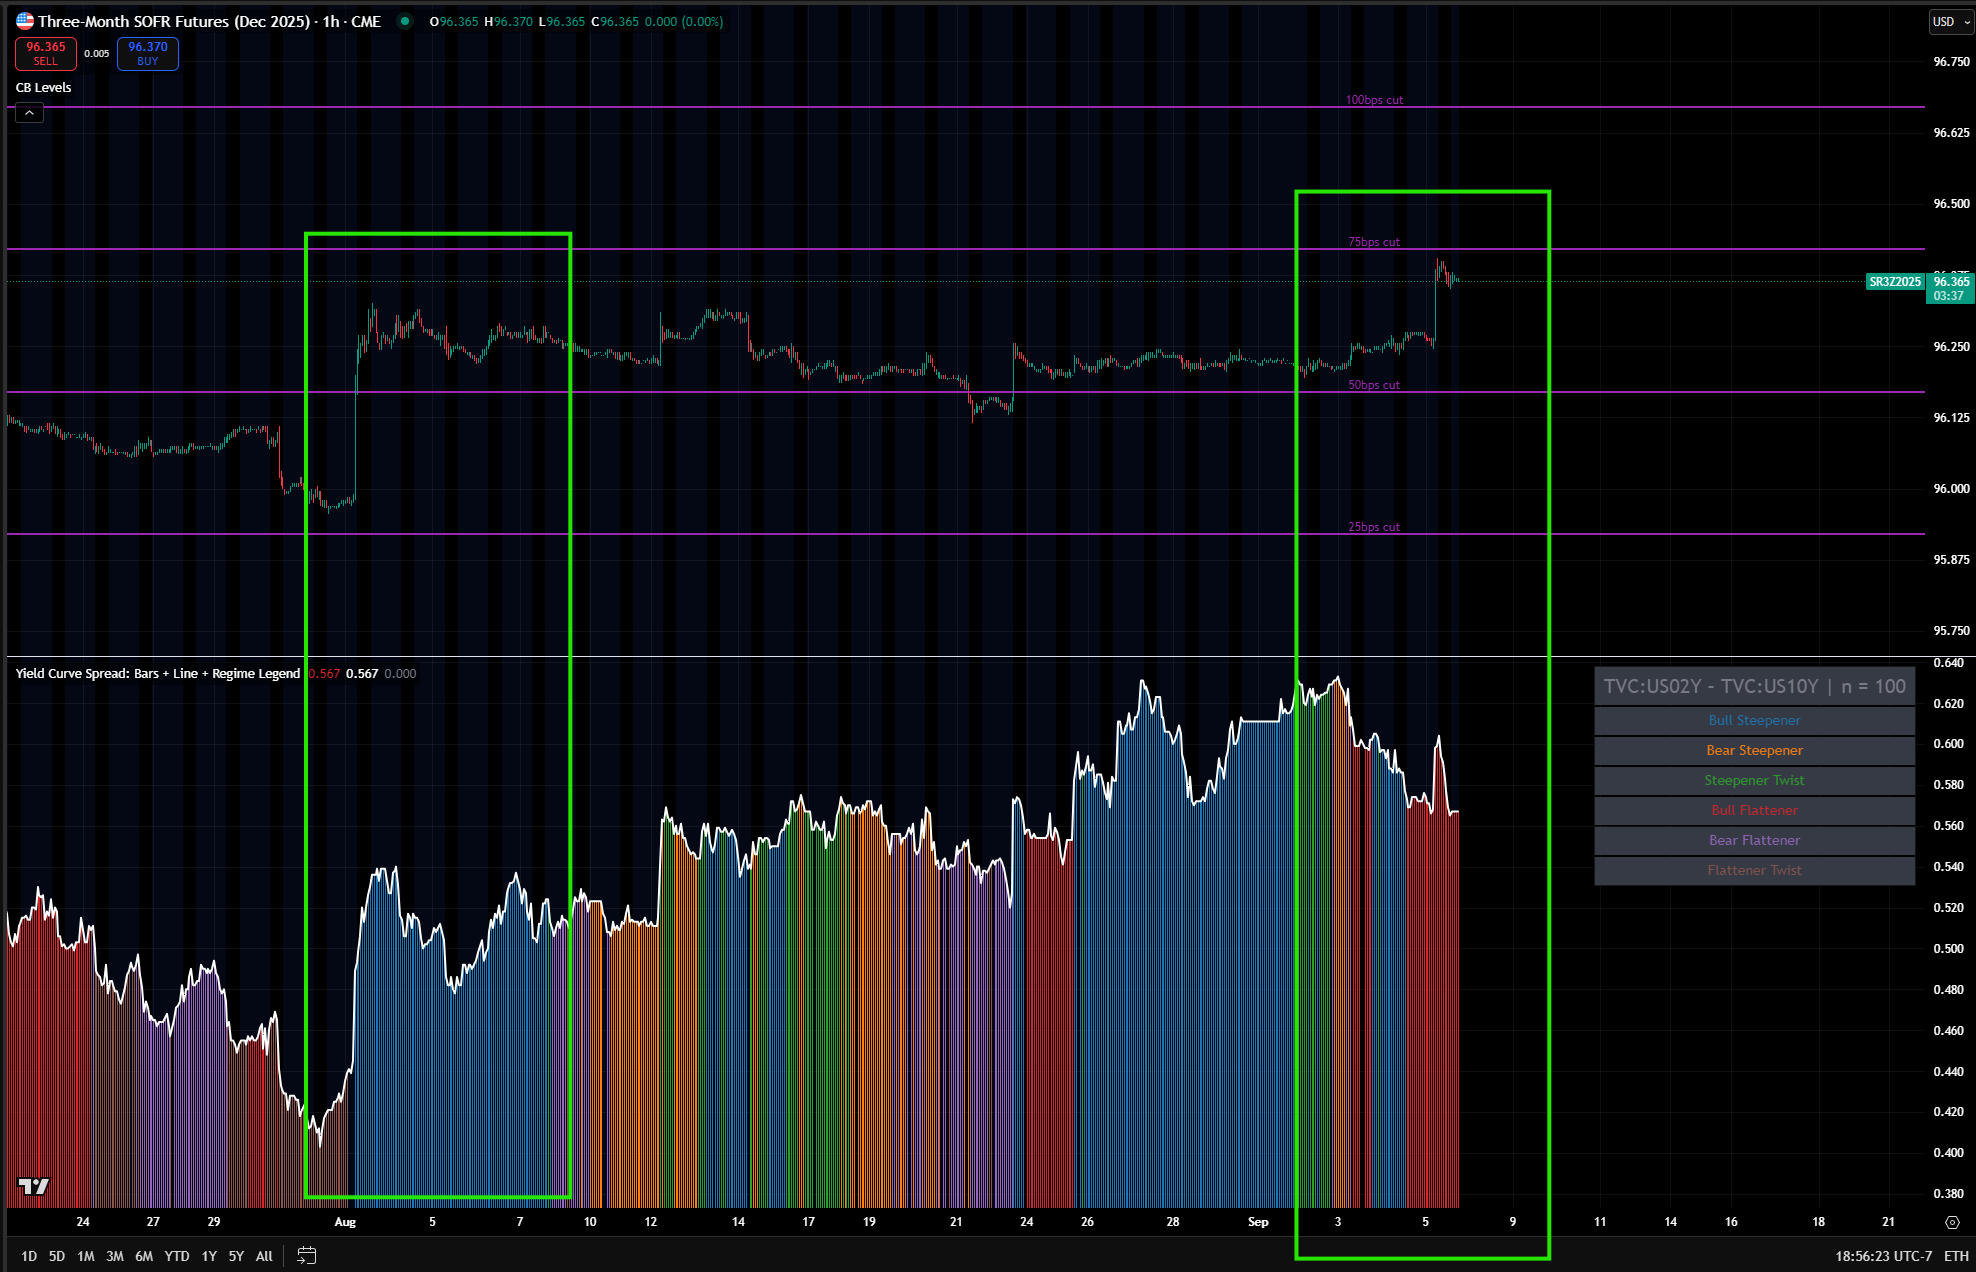
The
Fed is simply shifting its stance to overemphasize growth risk vs
inflation risk in order to justify cutting interest rates. The most
recent NFP prints have caused buying pressure in the short end (ZT in
the chart below) but we remain BELOW bid from earlier this year (yellow
line). We are likely to remain BELOW this level as we progress into the
Sept and Oct FOMC meeting because of how aggressively the 2025 contracts
are pricing rate cuts.
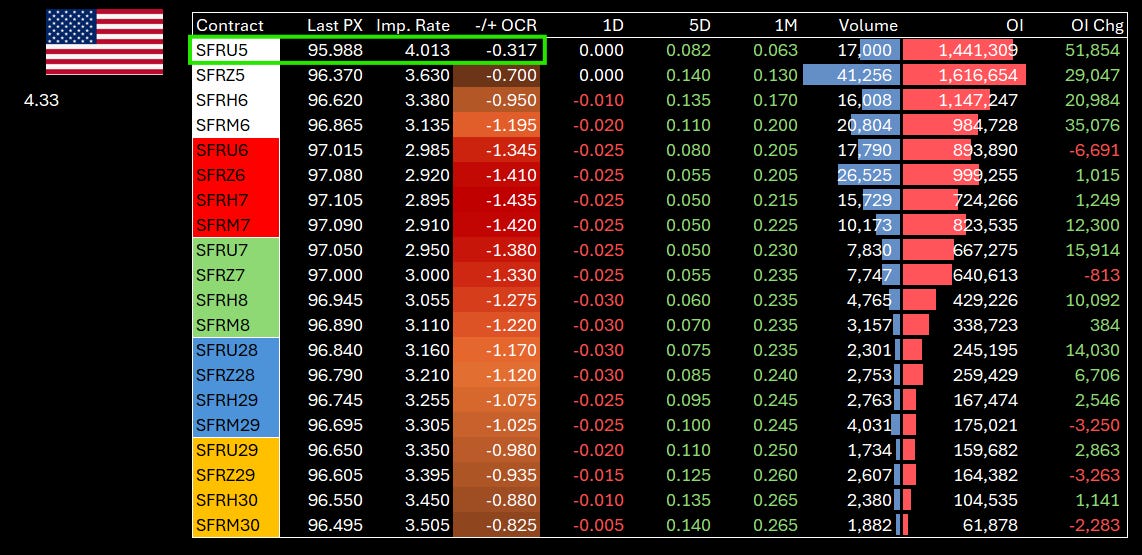
Notice that we are actually pricing a little bite more than a 25bps cut in the Sept FOMC meeting!
We
are almost certainly going to get a 25bps cut at the September FOMC,
and it is HIGHLY unlikely that we see a 50bps cut. Given Powell’s shift
at Jackson Hole, the recent labor market data, and the fact that 2s10s
has not been bear steepening or steepener twisting over the last 3
weeks, a cut at every meeting this year is a very real probability, but
it is likely the most dovish outcome.
The implication of this is
that there is fuctionally no upside in the Z5 contract if 75bps of cuts
are realized for 2025 (which would mean a 25bps cut at the remaining 3
FOMC meetings). As the Z5 and H7 contract have priced more cuts, the
2s10s curve has not bear steepened in a similar manner to 2024 when the
Fed cutting immediately caused long end rates to rally.
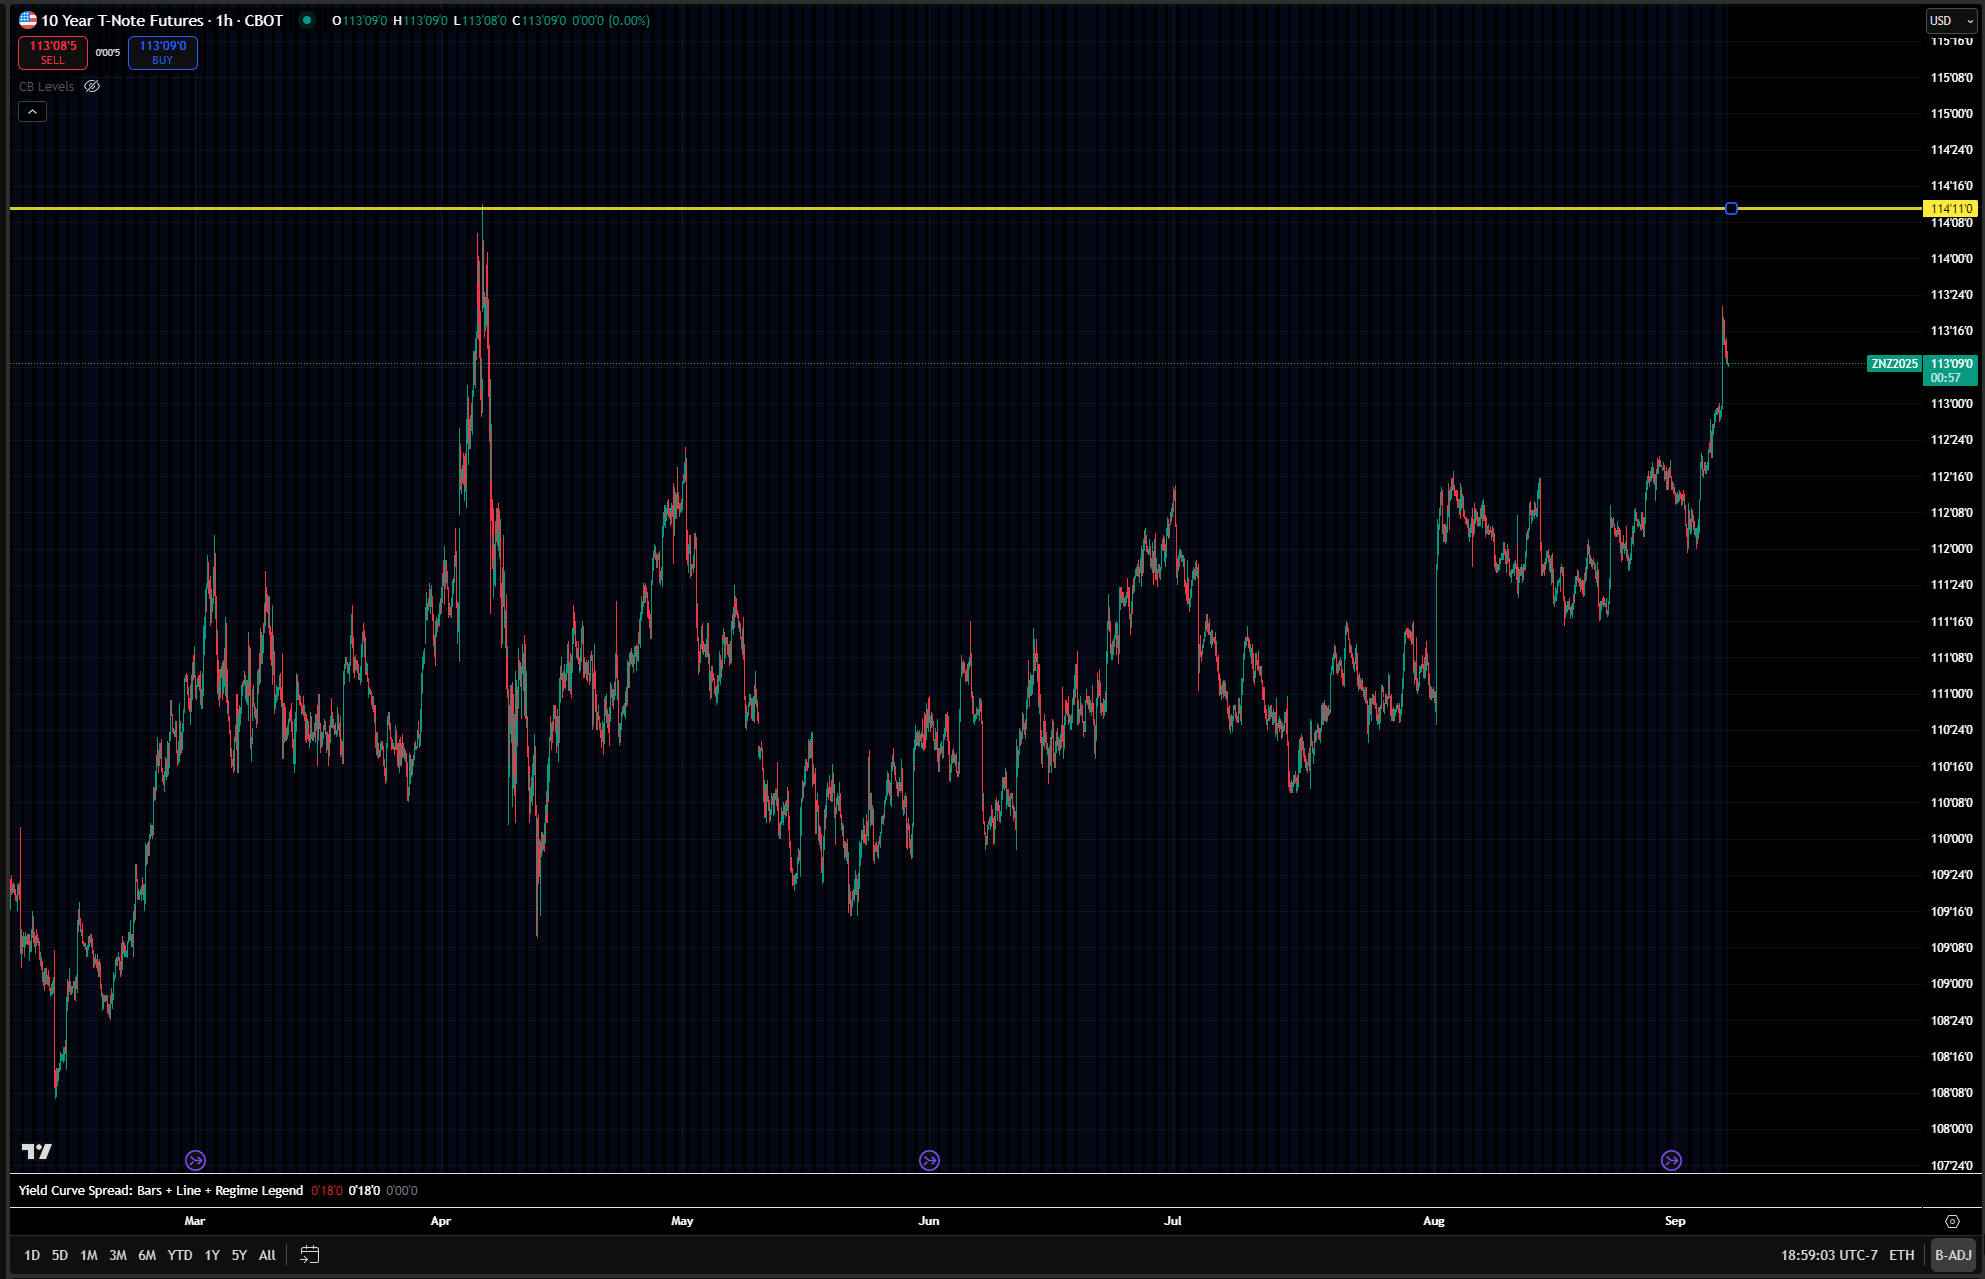
We
are now seeing the 10 year futures contract come back to the level it
was at during the drawdown in equities earlier this year. In my view, we
are unlikely to move ABOVE this level in ZN before the
Sept FOMC meeting and if we continue to have capital move out the risk
curve on equity rallies, it further decreases the probability of bonds
rallying.
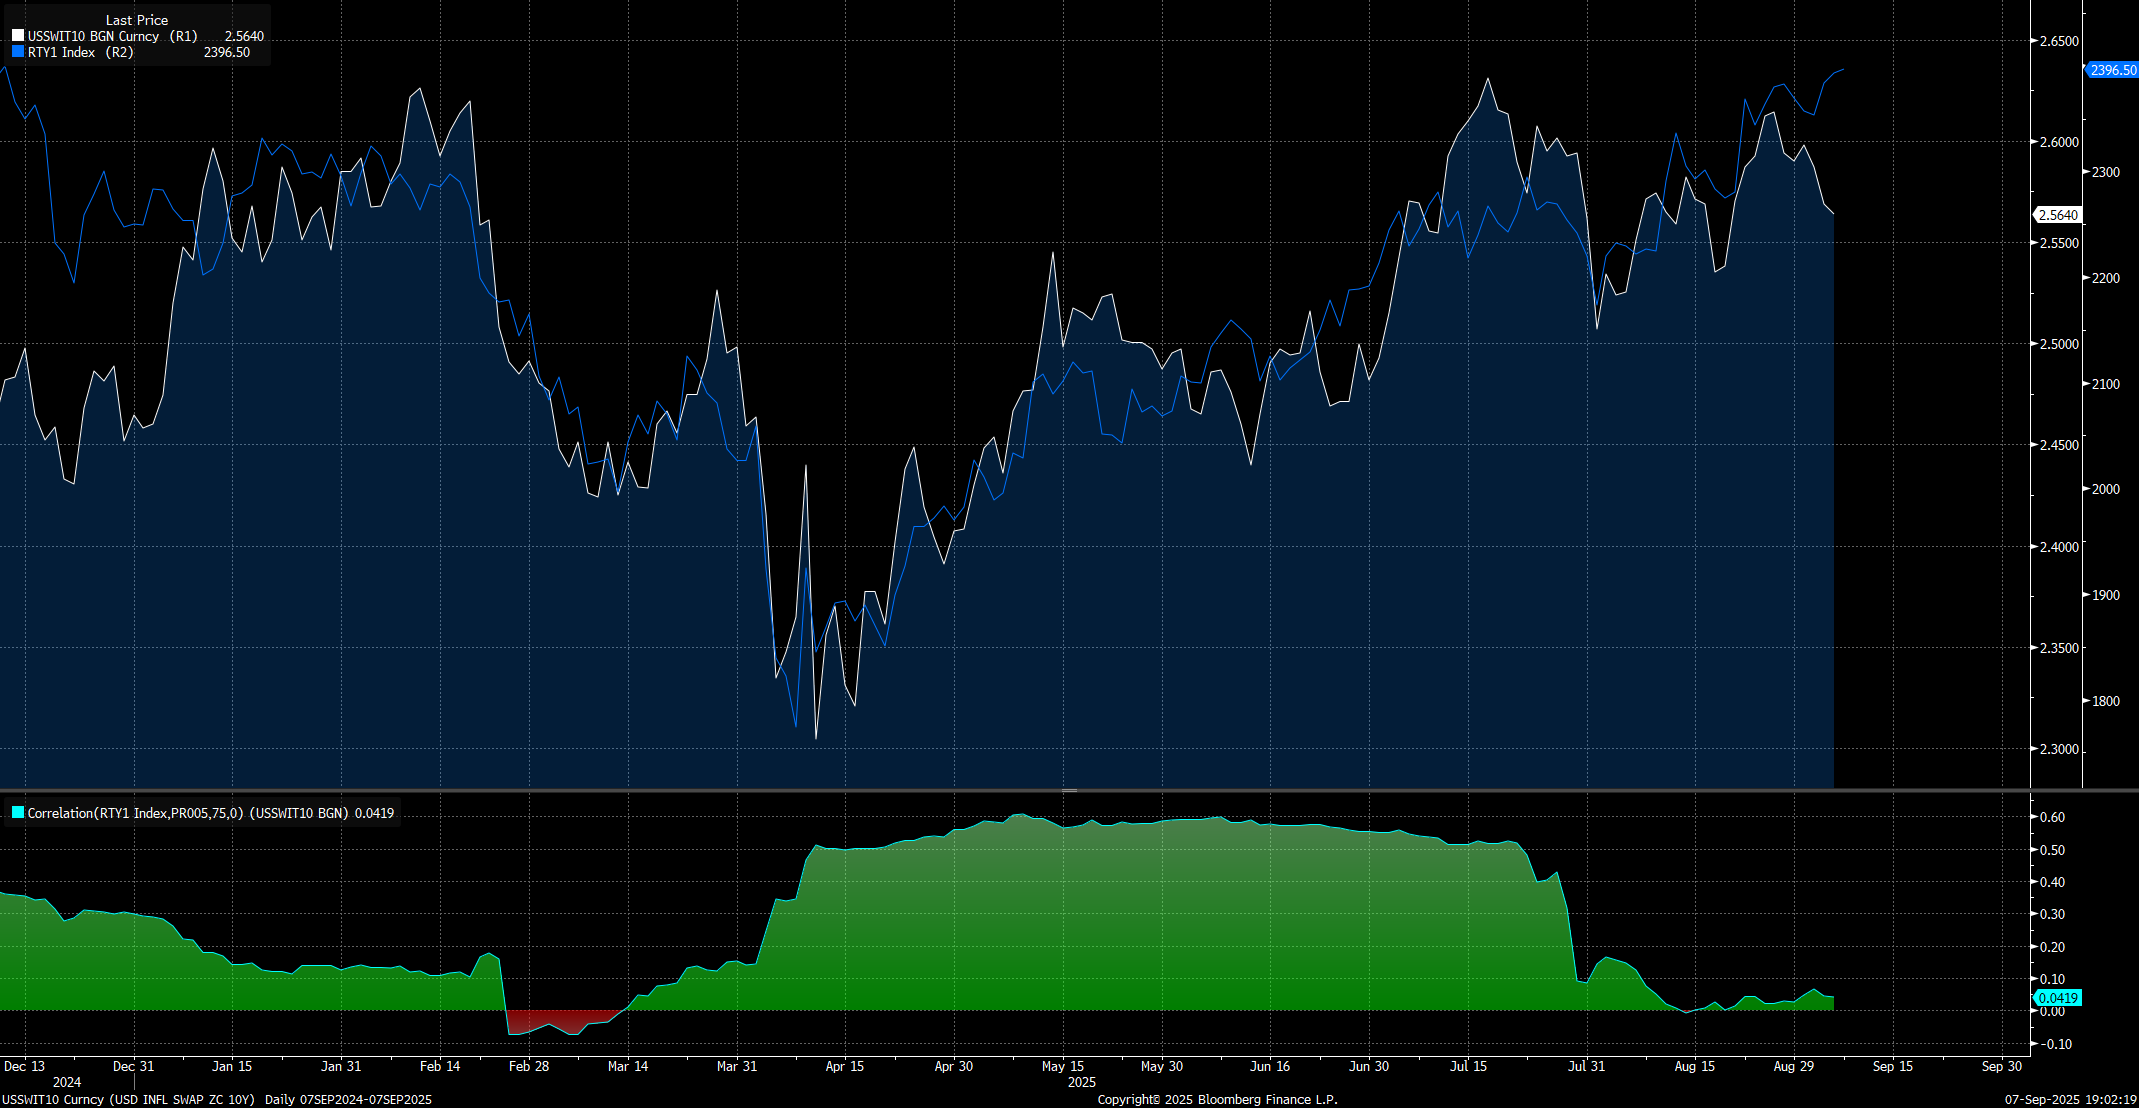
However,
the key differntiator for WHERE we are moving with long end rates is
how 10 year inflation swaps correlate to the further upside in equities.
If 10 year inflation swaps begin to have a negative correlation with
things like the Russell (blue line) then we could move into a Goldilocks
regime where stocks and bonds rally together. Inversely, if the equity
melt up begins to become a larger issue for inflation and drag up 10
year inflation swaps, then this will create significant headwinds for
bonds.
The
structural reality is clear: long-end rates are anchored in higher
ranges by resilient growth, yet capped from breaking higher by muted
inflation risk. Within that band, the short-term path is shaped by the
catalysts that hit month by month—CPI, PPI, PCE, labor market data, and
the FOMC. Each release acts as an intertemporal marker that tests
whether markets press the top of the range on temporary inflation scares
or the bottom on temporary recession scares.
What matters for
strategy is not predicting the exact future, but knowing where we are in
the cycle and how to adjust exposure. The scenarios below link the
structural regime to cyclical catalysts and provide a clear playbook for
households, businesses, investors, and governments to act decisively as
we move through the end of 2025.
TradingView — Track All Markets


![[FREE] Educational Primers On Every Aspect Of Macro & Markets](https://substackcdn.com/image/fetch/$s_!tfas!,w_140,h_140,c_fill,f_auto,q_auto:good,fl_progressive:steep,g_auto/https%3A%2F%2Fsubstack-post-media.s3.amazonaws.com%2Fpublic%2Fimages%2F69c49472-3d63-47f0-9b8c-2a682fa625f1_1024x1024.jpeg)