CoreLogic releases latest home price index findings
10 states posted annual losses, including
Washington (-7.7%),
Idaho (-5.9%),
Utah (-4.9%),
Nevada (-4.5%),
California (-3.6%),
Arizona (-2.6%),
Oregon (-2.6%),
Colorado (-2.1%),
Montana (-1.1%) and
New York (-1.1%).
Housing shortage keeps pressure on home prices – CoreLogi
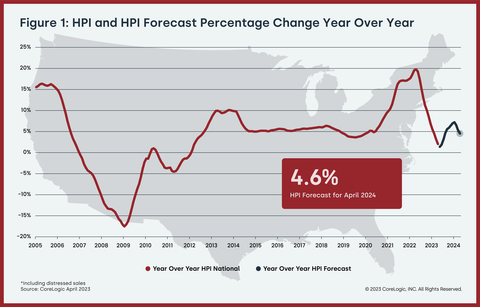
CoreLogic’s home price index (HPI) posted a 2% annual increase in April, marking the sixth month of single-digit gains.
CoreLogic said that while home prices continued to grow for the 135th month, the single-digit increase reflects the market slowdown seen in the past year. Month over month, prices rose by 1.2% from March.
“Numerous economic concerns are contributing to buyer reluctance, including mortgage rate volatility and the related uncertainty surrounding the recent debt-ceiling debate,” CoreLogic wrote in its HPI report. “That said, a continued shortage of homes for sale could keep pressure on housing prices over the next 12 months.”
Annual home price appreciation is expected to decelerate further in 2023 before regaining steam to 4.6% by April 2024.
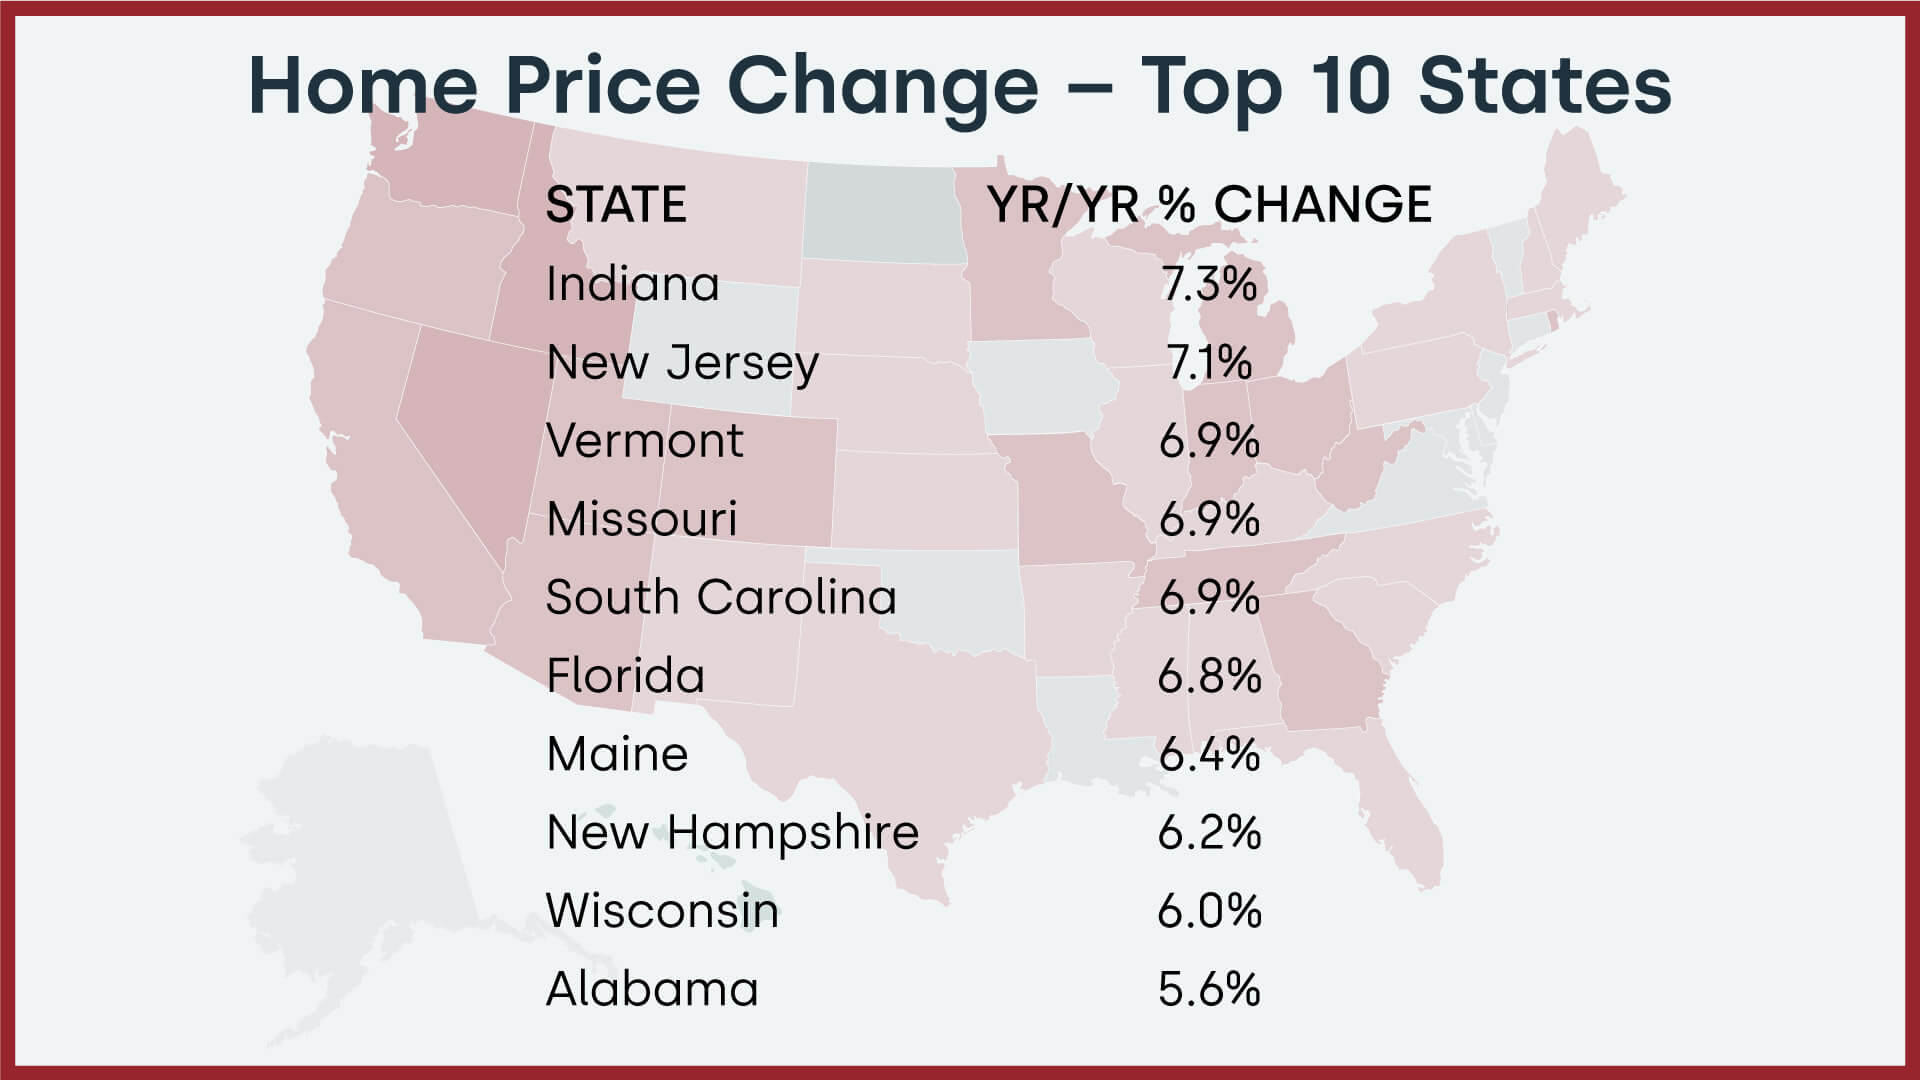
Miami saw the highest year-over-year home price gain of 13.2%, followed by Atlanta with 4.8%. Among states, Indiana and New Jersey registered the highest increase, at 7.3% and 7.1%, respectively.
On the other hand, 10 states posted annual losses, including Washington (-7.7%), Idaho (-5.9%), Utah (-4.9%), Nevada (-4.5%), California (-3.6%), Arizona (-2.6%), Oregon (-2.6%), Colorado (-2.1%), Montana (-1.1%) and New York (-1.1%).
June 6, 2023
US Home Price Insights – June 2023
Through April 2023 With Forecasts Through April 2024
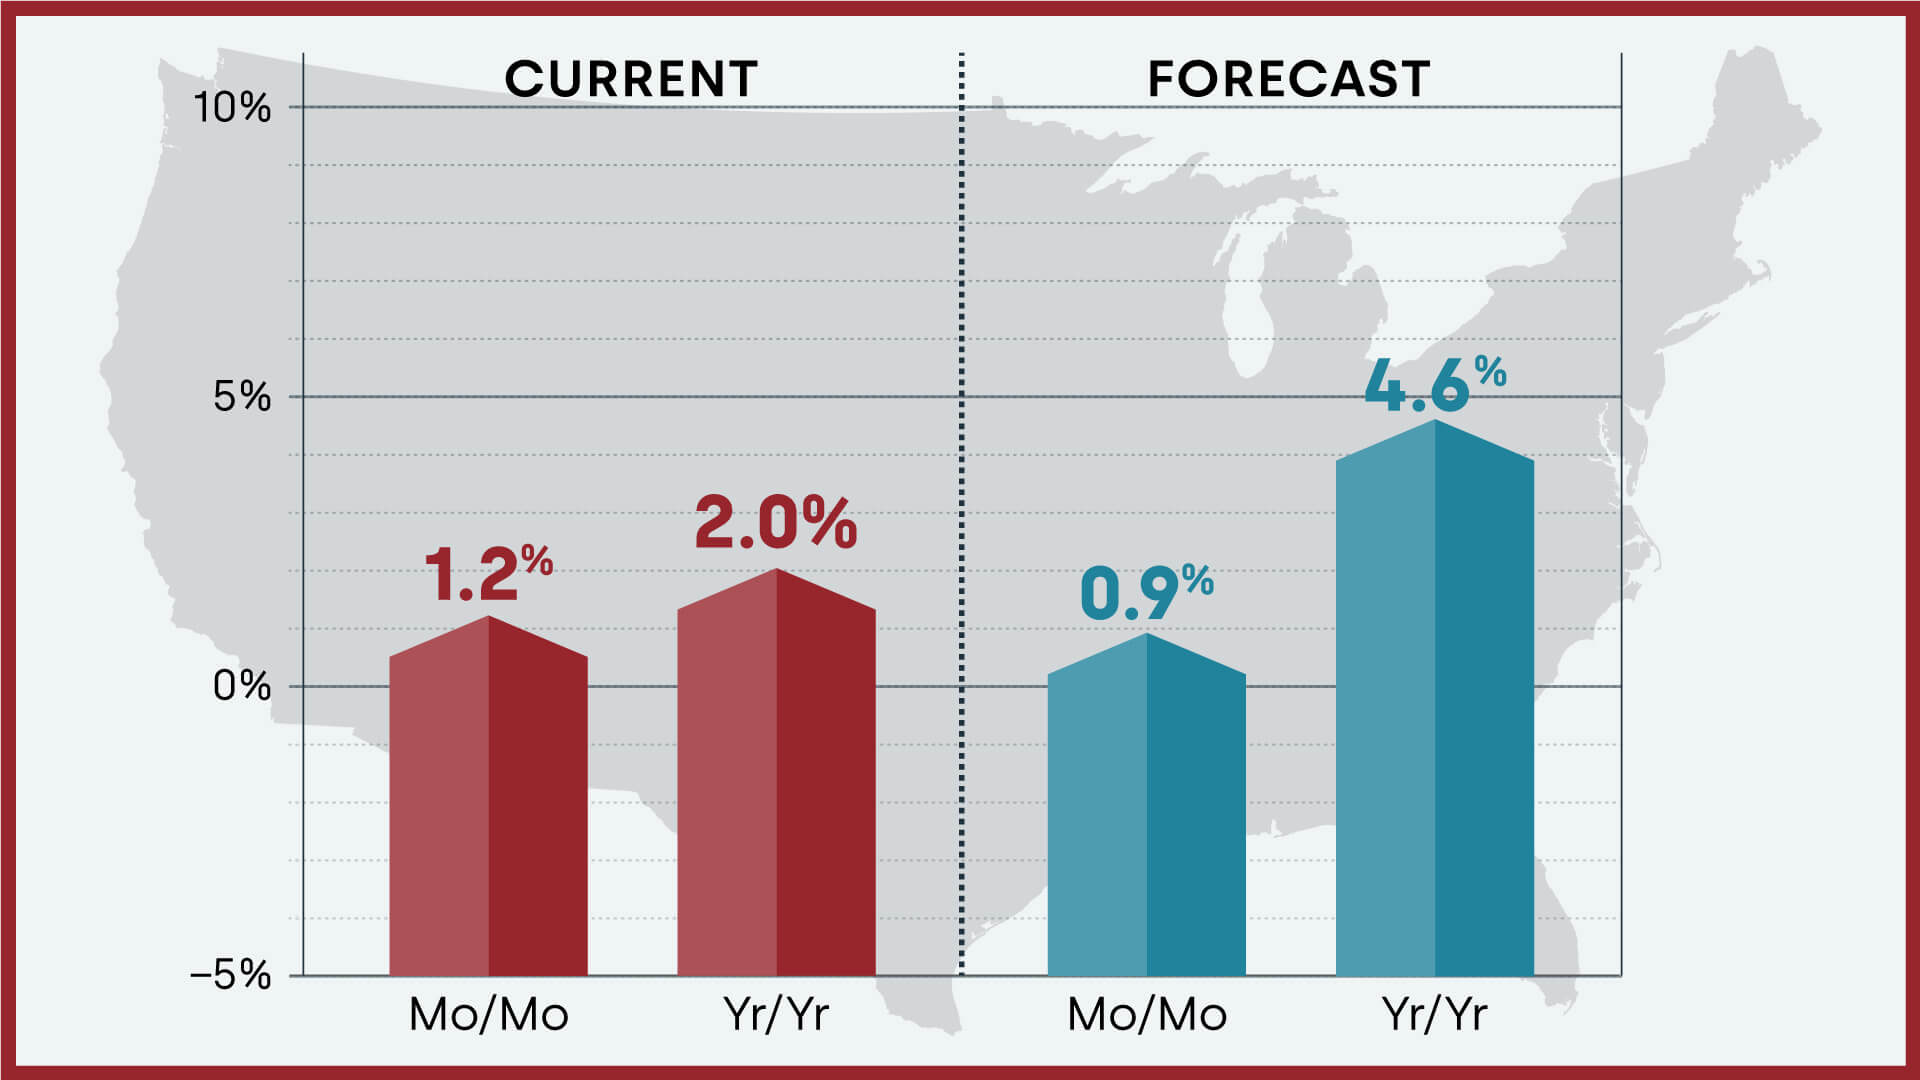
Home prices nationwide, including distressed sales, increased year over year by 2% in April 2023 compared with April 2022. On a month-over-month basis, home prices increased by 1.2% in April 2023 compared with March 2023 (revisions with public records data are standard, and to ensure accuracy, CoreLogic incorporates the newly released public data to provide updated results).
Forecast Prices Nationally
The CoreLogic HPI Forecast indicates that home prices will increase on a month-over-month basis by 0.9% from April 2023 to May 2023 and increase on a year-over-year basis by 4.6% from April 2023 to April 2024.
U.S. Home Price Growth Continues to Slow in April
Nationwide, single-family home price growth rose by 2% year over year in April. This marked the 135th consecutive month of annual growth but the sixth straight month of single-digit gains, which have slowed from an all-time high of nearly 20% annual appreciation in the spring of 2022.
Numerous economic concerns are contributing to buyer reluctance, including mortgage rate volatility and the related uncertainty surrounding the recent debt-ceiling debate. That said, a continued shortage of homes for sale could keep pressure on housing prices over the next 12 months. CoreLogic projects that home price growth will slow a bit more in 2023 before regaining steam to about 5% annual appreciation by April 2024.
“While mortgage rate volatility continues to cause buyer hesitation, the lack of for-sale homes is putting firm pressure on prices this spring, leading to above-average seasonal monthly gains and a rebound in home prices in most markets.Nevertheless, the recent surge in mortgage rates and continued inflation issues suggest that rates may remain elevated, leading home price appreciation to possibly relax this summer and return to average seasonal gains later in 2023.
Still, while slim inventory is pushing prices up once again and constraining affordability, recent trends suggest that home price growth in 2023 will fall in line with the historical 4% annual average.“
– Selma Hepp, Chief Economist for CoreLogic
HPI National and State Maps – April 2023
The CoreLogic HPI provides measures for multiple market segments, referred to as tiers, based on property type, price, time between sales, loan type (conforming vs. non-conforming) and distressed sales. Broad national coverage is available from the national level down to ZIP Code, including non-disclosure states.
Nationally, home prices increased 2% year over year in April. Arizona, California, Colorado, Idaho, Montana, Nevada, New York, Oregon, Utah and Washington saw annual declines in home prices. The states with the highest increases year over year were Indiana (7.3%); New Jersey (7.1%); and Missouri, South Carolina and Vermont (all 6.9%).
HPI Top 10 Metros Change
The CoreLogic HPI provides measures for multiple market segments, referred to as tiers, based on property type, price, time between sales, loan type (conforming vs. non-conforming) and distressed sales. Broad national coverage is available from the national level down to ZIP Code, including non-disclosure states. Below is a look at home price changes in large U.S. metros in April, with Miami again posting the largest gain at 13.2% year over year.
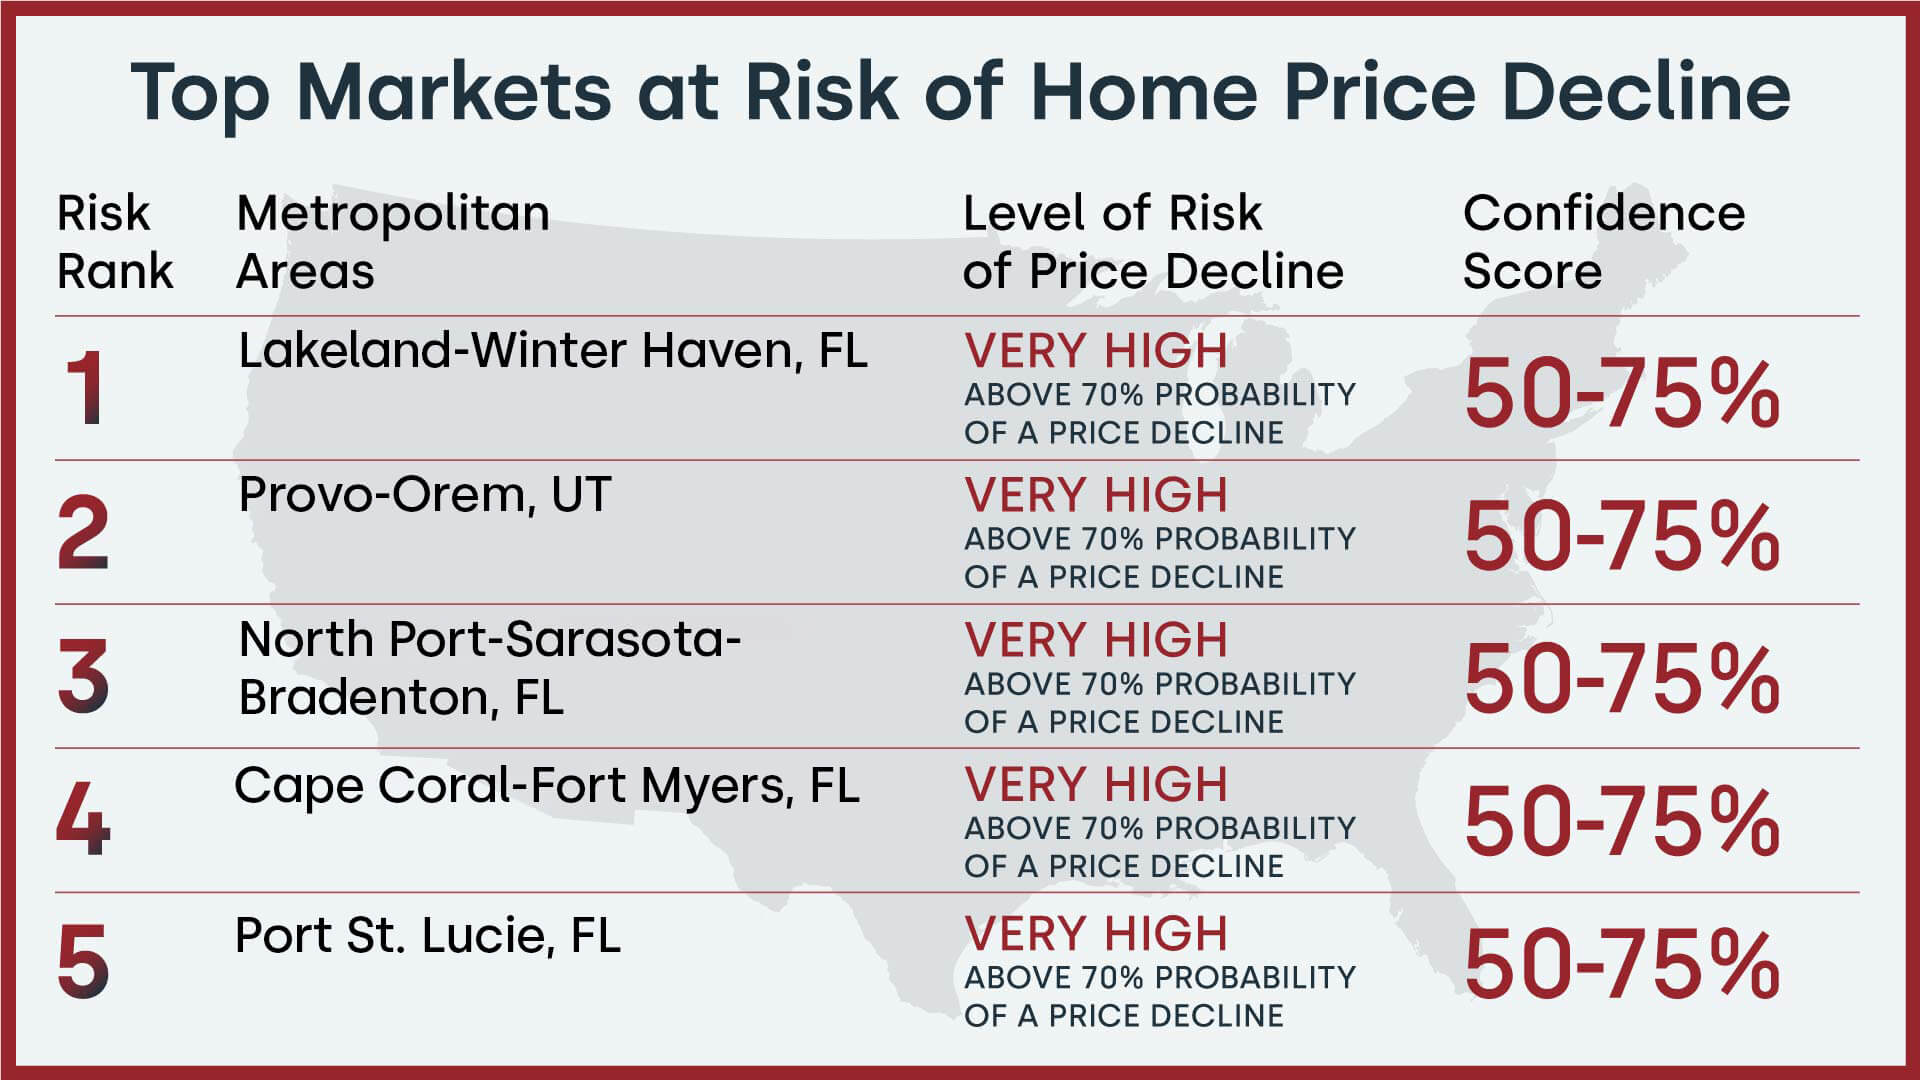
Markets to Watch: Top Markets at Risk of Home Price Decline
The CoreLogic Market Risk Indicator (MRI), a monthly update of the overall health of housing markets across the country, predicts that Lakeland-Winter Haven, FL is at a very high risk (70%-plus probability) of a decline in home prices over the next 12 months. Provo-Orem, UT; North Port-Sarasota-Bradenton, FL; Cape Coral-Fort Myers, FL and Port St. Lucie, FL are also at very high risk for price declines.
Summary
CoreLogic HPI features deep, broad coverage, including non-disclosure state data. The index is built from industry-leading real-estate public record, servicing, and securities databases—including more than 40 years of repeat-sales transaction data—and all undergo strict pre-boarding assessment and normalization processes.
CoreLogic HPI and HPI Forecasts both provide multi-tier market evaluations based on price, time between sales, property type, loan type (conforming vs. non-conforming) and distressed sales, helping clients hone in on price movements in specific market segments.
Updated monthly, the index is the fastest home-price valuation information in the industry—complete home-price index datasets five weeks after month’s end. The Index is completely refreshed each month—all pricing history from 1976 to the current month—to provide the most up-to-date, accurate indication of home-price movements available.
51 US cities expected to see the highest home-price increases and 5 at risk of falling in the next 12 months — plus where mortgage rates could be by year-end — according to a housing economist
The economist Selma Hepp says home prices in some areas are rising because of limited inventory.
Areas that saw price declines during the pandemic are expected to make a comeback, she said.
Anaheim, California; Seattle; and Sacramento, California; topped the list of Metropolitan areas.
The US housing market started off on a solid footing this year as home prices rose. But it's not necessarily because buyers are back in droves. High mortgage rates have kept would-be sellers locked into their current properties, making inventory tight and raising demand for the little that's on the market, Selma Hepp, the chief economist at CoreLogic, said.
...Below is a list of 51 metropolitan areas expected to see the most home-price increases in the next 12 months, from the highest to the lowest.
The data is taken from CoreLogic's HPI, which measures the year-over-year changes in single-family-home values based on data from more than 400 US cities.
The index changes are based on repeat sales of the same properties.
Metropolitan area
HPI YOY%
Forecasted YOY%
Anaheim-Santa Ana-Irvine CA Metropolitan Division
-0.73
10.3161
Seattle-Bellevue-Everett WA Metropolitan Division
-10.38
10.0377
Sacramento--Roseville--Arden-Arcade CA Metropolitan Statistical Area
-6.96
9.9691
Oakland-Hayward-Berkeley CA Metropolitan Division
-10.09
9.8245
Portland-Vancouver-Hillsboro OR-WA Metropolitan Statistical Area
-4.58
8.2212
Riverside-San Bernardino-Ontario CA Metropolitan Statistical Area
-1.48
8.1907
San Diego-Carlsbad CA Metropolitan Statistical Area
-2.68
7.9938
Denver-Aurora-Lakewood CO Metropolitan Statistical Area
-2.84
7.7273
Jacksonville FL Metropolitan Statistical Area
5.05
6.7077
Las Vegas-Henderson-Paradise NV Metropolitan Statistical Area
-4.1
6.614
Tampa-St. Petersburg-Clearwater FL Metropolitan Statistical Area
4.69
6.3685
Newark NJ-PA Metropolitan Division
6.59
6.1793
Orlando-Kissimmee-Sanford FL Metropolitan Statistical Area
6.69
6.1298
Los Angeles-Long Beach-Glendale CA Metropolitan Division
-2.82
6.042
West Palm Beach-Boca Raton-Delray Beach FL Metropolitan Division
6.63
6.0164
Cambridge-Newton-Framingham MA Metropolitan Division
0.5
5.9048
Nassau County-Suffolk County NY Metropolitan Division
-0.65
5.7747
Baltimore-Columbia-Towson MD Metropolitan Statistical Area
3.68
5.7685
Fort Lauderdale-Pompano Beach-Deerfield Beach FL Metropolitan Division
7.43
5.5688
Boston MA Metropolitan Division
0.67
5.4016
Phoenix-Mesa-Scottsdale AZ Metropolitan Statistical Area
Atlanta-Sandy Springs-Roswell GA Metropolitan Statistical Area
4.82
4.9643
Minneapolis-St. Paul-Bloomington MN-WI Metropolitan Statistical Area
-0.12
4.9623
Nashville-Davidson--Murfreesboro--Franklin TN Metropolitan Statistical Area
1.38
4.7932
Virginia Beach-Norfolk-Newport News VA-NC Metropolitan Statistical Area
6.84
4.7326
Detroit-Dearborn-Livonia MI Metropolitan Division
2.64
4.307
Charlotte-Concord-Gastonia NC-SC Metropolitan Statistical Area
4.68
4.218
Milwaukee-Waukesha-West Allis WI Metropolitan Statistical Area
6.15
4.0918
Philadelphia PA Metropolitan Division
1.69
4.0543
St. Louis MO-IL Metropolitan Statistical Area
4.17
3.644
Kansas City MO-KS Metropolitan Statistical Area
4.97
3.5144
Providence-Warwick RI-MA Metropolitan Statistical Area
3.15
3.4637
Chicago-Naperville-Arlington Heights IL Metropolitan Division
3.36
3.4629
Richmond VA Metropolitan Statistical Area
3.81
3.1682
Cincinnati OH-KY-IN Metropolitan Statistical Area
6.07
3.0565
Pittsburgh PA Metropolitan Statistical Area
0.97
2.9902
Warren-Troy-Farmington Hills MI Metropolitan Division
2.03
2.9774
Oklahoma City OK Metropolitan Statistical Area
4.87
2.9635
Cleveland-Elyria OH Metropolitan Statistical Area
4.09
2.7892
San Antonio-New Braunfels TX Metropolitan Statistical Area
1.8
2.4221
New York-Jersey City-White Plains NY-NJ Metropolitan Division
0.78
2.3719
Austin-Round Rock TX Metropolitan Statistical Area
-6.88
2.3515
Columbus OH Metropolitan Statistical Area
4.62
2.3468
Houston-The Woodlands-Sugar Land TX Metropolitan Statistical Area
4.5
2.2728
Indianapolis-Carmel-Anderson IN Metropolitan Statistical Area
6.44
1.9631
Fort Worth-Arlington TX Metropolitan Division
1.04
1.5919
Dallas-Plano-Irving TX Metropolitan Division
2.15
1.2522
The metropolitan areas listed below have the highest probability of seeing price declines in the next 12 months.
"In these markets, when we look at how much prices exceed local incomes, it has been substantial. And that increases the vulnerability for price declines going forward," Hepp said.
The CoreLogic HPI
Finally, while mortgage rates can be difficult to predict, Hepp said that we had likely peaked for the year. CoreLogic expects that mortgage rates will gradually decline for the remainder of the year to about 5.8% if inflation rates continue to decline, she said."


No comments:
Post a Comment