U.S. Environmental Protection Agency
Fifth Edition of the Climate Change Indicators Report
EPA has released the fifth edition of its Climate Change Indicators in the United States Report. Dive in to see updated data, learn about connections, and review two brand new indicators to the collection.
Read the reportThis indicator describes trends in multi-day extreme heat events across the United States.
Key Points
- Heat waves are occurring more often than they used to in major cities across the United States. Their frequency has increased steadily, from an average of two heat waves per year during the 1960s to six per year during the 2010s and 2020s (Figure 1).
- In recent years, the average heat wave in major U.S. urban areas has been about four days long. This is about a day longer than the average heat wave in the 1960s (Figure 1).
- The average heat wave season across the 50 cities in this indicator is about 46 days longer now than it was in the 1960s (Figure 1). Timing can matter, as heat waves that occur earlier in the spring or later in the fall can catch people off-guard and increase exposure to the health risks associated with heat waves.
- Heat waves have become more intense over time. During the 1960s, the average heat wave across the 50 cities in Figures 1 and 2 was 2.0°F above the local 85th percentile threshold. During the 2020s, the average heat wave has been 2.5°F above the local threshold (Figure 1).
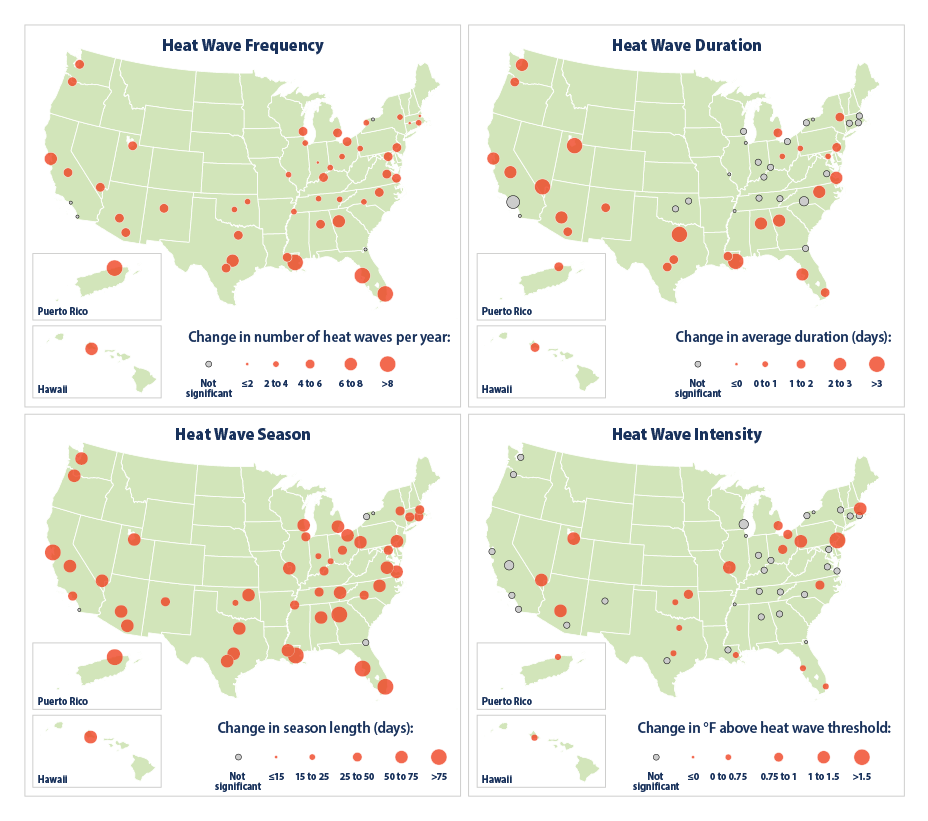
- Of the 50 metropolitan areas in this indicator, 46 experienced a statistically significant increase in heat wave frequency between the 1960s and 2020s. Heat wave duration has increased significantly in 28 of these locations, the length of the heat wave season in 46, and intensity in 20 (Figure 2).
- Longer-term records show that heat waves in the 1930s remain the most severe in recorded U.S. history (Figure 3). The spike in Figure 3 reflects extreme, persistent heat waves in the Great Plains region during a period known as the “Dust Bowl.” Poor land use practices and many years of intense drought contributed to these heat waves by depleting soil moisture and reducing the moderating effects of evaporation.5
Background
A persistent period of unusually hot days is referred to as an extreme heat event or a heat wave. Heat waves are more than just uncomfortable: they can lead to illness and death, particularly among older adults, the very young, and other vulnerable populations (see the Heat-Related Deaths and Heat-Related Illnesses indicators).1 Prolonged exposure to excessive heat can lead to other impacts as well—for example, damaging crops, injuring or killing livestock, and increasing the risk of wildfires. Prolonged periods of extreme heat can lead to power outages as heavy demands for air conditioning strain the power grid.
Unusually hot days and heat wave events are a natural part of day-to-day variation in weather. As the Earth’s climate warms, however, hotter-than-usual days and nights are becoming more common (see the High and Low Temperatures indicator) and heat waves are expected to last longer and become more frequent and intense.2 Increases in these extreme heat events can lead to more heat-related illnesses and deaths, especially if people and communities do not take steps to adapt.3 Even small increases in extreme heat can result in increased deaths and illnesses.4
About the Indicator
This indicator examines trends over time in four key characteristics of heat waves in the United States:
- Frequency: the number of heat waves that occur every year.
- Duration: the length of each individual heat wave, in days.
- Season length: the number of days between the first heat wave of the year and the last.
- Intensity: how hot it is during the heat wave.


No comments:
Post a Comment