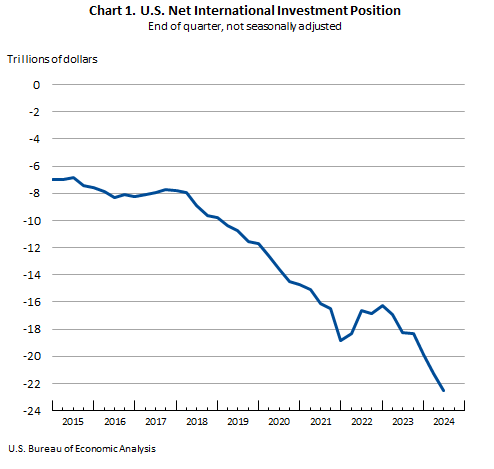
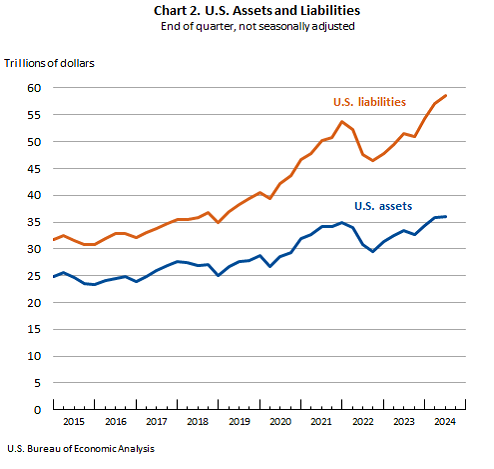
The U.S. net international investment position, the difference between U.S. residents’ foreign financial assets and liabilities, was –$22.52 trillion at the end of the second quarter of 2024, according to statistics released today by the U.S. Bureau of Economic Analysis (chart 1). Assets totaled $36.00 trillion, and liabilities were $58.52 trillion (chart 2). At the end of the first quarter, the net investment position was –$21.29 trillion (revised). The net investment position and components of assets and liabilities are presented in table 1.
The –$1.23 trillion change in the net investment position from the first quarter to the second quarter came from net financial transactions of –$299.8 billion and net other changes in position, such as price and exchange-rate changes, of –$930.5 billion (table 2).
Price changes of –$616.9 billion reflected U.S. stock price increases that exceeded foreign stock price increases, which raised the market value of U.S. liabilities more than U.S. assets.
Exchange-rate changes of –$214.8 billion reflected foreign currency depreciation against the U.S. dollar, which lowered the value of U.S. assets more than U.S. liabilities in dollar terms.
U.S. assets increased by $173.2 billion to a total of $36.00 trillion at the end of the second quarter, mainly attributable to a $112.8 billion increase in financial derivatives (chart 3). The increase in financial derivatives mostly reflected increases in single-currency interest rate contracts.
Portfolio investment and direct investment assets (the two largest categories of assets) changed little in the second quarter, as financial transactions and foreign stock price increases were mostly offset by foreign currency depreciation against the U.S. dollar that lowered the value of foreign-currency-denominated assets in dollar terms (table 2).
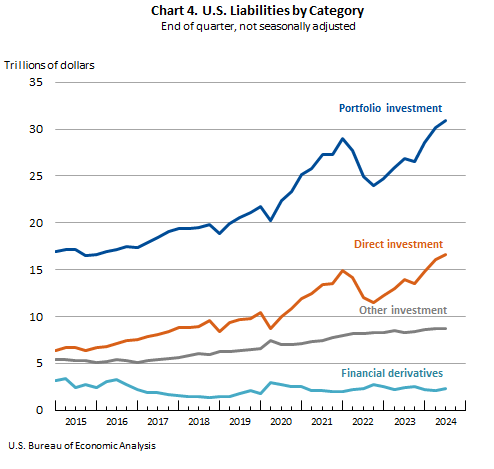
U.S. liabilities increased by $1.40 trillion to a total of $58.52 trillion at the end of the second quarter, driven mainly by U.S. stock price increases that raised the market value of portfolio investment and direct investment liabilities (chart 4). Financial transactions of $391.1 billion, notably foreign purchases of U.S. stocks and long-term debt securities, also contributed to the overall increase in U.S. liabilities.
Portfolio investment liabilities increased by $666.4 billion to $30.89 trillion, and direct investment liabilities increased by $568.2 billion to $16.64 trillion, mostly attributable to U.S. stock price increases (table 2).
Table A. Updates to First-Quarter 2024 International Investment Position Aggregates
[Trillions of dollars, not seasonally adjusted]
| | Preliminary estimates | Revised estimates |
| U.S. net international investment position | –21.28 | –21.29 |
| U.S. assets | 35.78 | 35.83 |
| U.S. liabilities | 57.06 | 57.12 |
U.S. Bureau of Economic Analysis |
Next release: December 27, 2024, at 8:30 a.m. EST
U.S. International Investment Position, 3rd Quarter 2024


.png)


No comments:
Post a Comment