US Productivity and Costs: 2nd Quarter 2017, Preliminary
PRODUCTIVITY AND COSTS Second QuartThe Labor Department's report on labor productivity and costs can be accessed at: https://www.bls.gov/news.release/ prod2.nr0.htm [21 PAGES]

Technical information: (202) 691-5606 • Productivity@bls.gov • www.bls.gov/lpc
Media contact: (202) 691-5902 • PressOffice@bls.gov

Blogger Note: InfoGraphic about STEM jobs
US Productivity and Costs: 2nd Quarter 2017, Preliminary
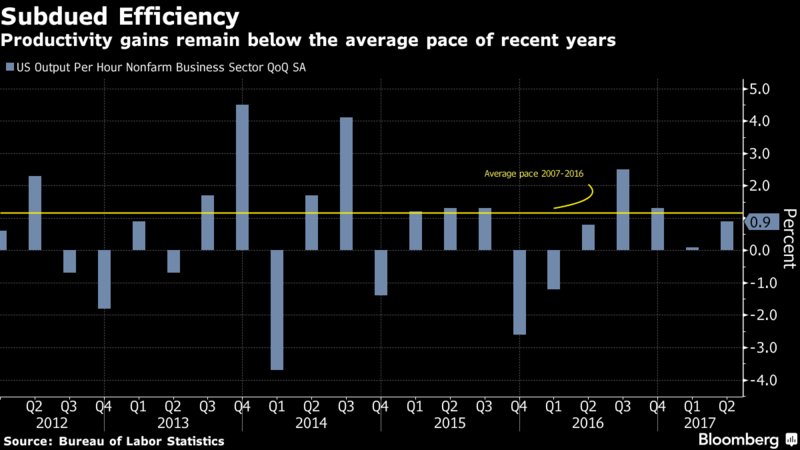
Nonfarm business sector labor productivity increased 0.9 percent during the second quarter of 2017, the U.S. Bureau of Labor Statistics reported today, as output increased 3.4 percent and hours worked increased 2.5 percent. (All quarterly percent changes in this release are seasonally adjusted annual rates.) From the second quarter of 2016 to the second quarter of 2017, productivity increased 1.2 percent, reflecting a 2.7-percent increase in output and a 1.5-percent increase in hours worked. (See tables A1 and 2.) Labor productivity, or output per hour, is calculated by dividing an index of real output by an index ... (full story)
Headline From Bloomberg:
U.S. Productivity Picks Up While Remaining Below Recent Average
Worker productivity gains in the U.S. accelerated in the second quarter while remaining below the tepid pace of the current expansion, a Labor Department report showed Wednesday. Highlights of Productivity (2Q) • Measure of nonfarm business employee output per hour increased at 0.9% annualized rate (est. 0.7% rise) after an upwardly revised 0.1% rise in the prior three months • Unit labor costs rose at 0.6% pace (est. 1.1%) after a an upwardly revised 5.4% rate • Report reflects annual revisions to economy-wide data from July 28, including upward revision to hourly compensation in 1Q. Paltry productivity has been a ... (full story)

U.S. Productivity Rose at 0.9% Rate in Second Quarter
WASHINGTON--U.S. worker productivity picked up in the second quarter but has remained worryingly sluggish throughout the current economic expansion.
Nonfarm business-sector productivity, measured as the goods and services produced per hour worked, increased at a 0.9% seasonally adjusted annual rate in the second quarter, up from a 0.1% growth rate for the first three months of 2017, the Labor Department said Wednesday. Economists surveyed by The Wall Street Journal had expected a 0.6% growth rate for the latest quarter.Output rose at a 3.4% rate from the first quarter, while hours worked were up at a 2.5% pace.
Compared with a year earlier, productivity was up 1.2% in the second quarter as output rose faster than hours worked.
Productivity data tend to be volatile from quarter to quarter, and Wednesday's report included revisions going back several years. The productivity trend was slightly stronger than earlier estimated in 2014 and 2015, and slightly weaker than initially thought in 2016. Productivity fell 0.1% last year, the first calendar-year decline since 1982.
Annual growth averaged 1.2% from 2007 to 2016, well below the long-term average of 2.1%.
Unit labor costs at nonfarm businesses rose at a 0.6% rate in the second quarter; economists had expected a 1.0% growth pace. From a year earlier, unit labor costs fell 0.2%.
In theory, higher labor costs can be passed on to consumers in the form of higher prices, though wage growth and consumer-price inflation have both been sluggish in recent years.
Productivity is a critical factor for determining the future trajectory of wages, prices and overall economic output. Rapid productivity gains, as seen during the information technology-fueled boom of the late 1990s and early 2000s, can boost household incomes and economic growth.
Sluggish productivity growth, on the other hand, can cause slower economic growth and prevent wages from rising much without generating uncomfortably high inflation.
"If labor productivity grows an average of 2% per year, average living standards for our children's generation will be twice what we experienced," Federal Reserve Vice Chairman
In the U.S., productivity growth was slowing before the recession began in
Looking forward, some forecasters think continued sluggish productivity gains will help keep overall economic growth from exceeding its modest recent pace of roughly 2% a year. President
Government policies could help promote stronger productivity growth, Mr. Fischer said, mentioning the potential for investment in basic research, early childhood education programs, infrastructure and other priorities.
"Reasonable people can disagree about the right way forward, but if we as a society are to succeed, we need to follow policies that will support and advance productivity growth," Mr. Fischer said. "That is easier said than done. But it can be done."
The Labor Department's report on labor productivity and costs can be accessed at: https://www.bls.gov/news.release/ prod2.nr0.htm
Write to

Manufacturing sector labor productivity increased 2.5 percent in the second quarter of 2017, as output increased 1.6 percent and hours worked decreased 0.9 percent. Output per hour increased 3.8 percent in the durable goods manufacturing sector and edged down 0.1 percent in the nondurable goods sector. Over the last four quarters, manufacturing sector productivity increased 1.0 percent, as output increased 1.5 percent and hours worked increased 0.4 percent. (See tables A1, 3, 4 and 5.) Unit labor costs in manufacturing decreased 0.3 percent in the second quarter of 2017 and rose 0.1 percent from the same quarter a year ago. The concepts, sources, and methods used for the manufacturing output series differ from those used in the business and nonfarm business output series; these output measures are not directly comparable. See the Technical Notes for a more detailed explanation. (See page 7.)


Historical revisions to quarterly labor productivity in the nonfarm business sector are presented in Charts 3 and 4. Chart 3 shows the revised and previous estimates of percent changes from previous quarter for the first quarter of 2013 through the first quarter of 2017. The noteworthy revisions to productivity begin in 2014 and mirror the NIPA revisions to output. The period from the first quarter of 2014 through the second quarter of 2015 was characterized by mostly upward revisions (with the largest being a 1.5-percentage point upward revision in the first quarter of 2015), while third-quarter 2015 through first-quarter 2017 saw mainly downward revisions.
Chart 4 shows the previous and revised percent changes from the same quarter a year ago in nonfarm business labor productivity. After revision, the four-quarter rate of productivity growth was higher than previously reported in every quarter of 2014 and 2015, and was lower than previously reported in each quarter of 2016.
Annual Average productivity growth in the nonfarm business sector in 2016 was revised down to a decrease of 0.1 percent. (See table C1.) As revised, the decrease in productivity in 2016 is the first annual decrease since a 1.0-percent decrease in 1982. In 2015 and 2014, annual productivity growth was revised up to increases of 1.3 percent and 1.0 percent, respectively. The average annual rate of productivity growth from 2012 to 2016—the period affected by the revisions—was unrevised at 0.6 percent per year. Unit labor costs increased 1.0 percent in the nonfarm business sector in 2016, rather than increasing 2.2 percent, as a 1.6-percentage point downward revision to hourly compensation was partially offset by a 0.3-percentage point downward revision to productivity. As revised, hourly compensation increased 0.9 percent in the nonfarm business sector, the smallest increase in the series which begins in 1947. Real hourly compensation declined 0.4 percent in 2016 rather than increasing 1.2 percent. There were small upward revisions to hourly compensation and real hourly compensation in 2014 and 2015. Manufacturing sector productivity increased 0.3 percent in the first quarter of 2017—slightly less than previously reported. Productivity decreased 0.9 percent in the durable goods sector and increased 2.6 percent in the nondurable goods sector. (See table B1.) Unit labor costs increased 3.9 percent in the manufacturing sector rather than increasing 2.4 percent as reported June 5, reflecting both a small downward revision to productivity and a 1.3-percentage point upward revision to hourly compensation. Real hourly compensation increased 1.0 percent, as revised. Annual average manufacturing productivity grew 0.2 percent in 2016, unrevised from the previously reported estimate. Productivity was unrevised in the manufacturing sector in 2015 and 2014. Unit labor costs was revised down to an increase of 0.6 percent in 2016, reflecting a 1.9-percentage point downward revision to hourly compensation. After revision, manufacturing real hourly compensation declined 0.5 percent in 2016 rather than increasing 1.3 percent. (See tables C1, 3, 4, and 5.)
Nonfinancial corporate sector productivity growth was revised up in the first quarter of 2017, to an increase of 2.0 percent, rather than the previously published decrease of 1.5 percent; this revision was due solely to a 3.5-percentage point upward revision to output; hours were unrevised. (See table A2.)
Annual average productivity in the nonfinancial corporate sector decreased 0.1 percent in 2016, a downward revision from the previously reported 0.4-percent increase. This measure was revised up 0.6 percentage point in 2015 to an increase of 1.4 percent, and was revised up 1.0 percentage point in 2014 to an increase of 1.3 percent. (See tables C1 and 6.)
______________
Methodology change for manufacturing output Beginning with the Productivity and Costs news release scheduled for December 6, 2017, BLS plans to incorporate source data reflecting a change in methodology for estimating manufacturing output. For more information see: www.bls.gov/mfp/sectoraloutputrevisions.htm. The revised Productivity and Costs news release for second-quarter 2017 is scheduled to be released on Thursday, September 7, 2017 at 8:30 a.m. (EDT).
TECHNICAL NOTES
Labor Hours Hours data for the labor productivity and cost measures include hours worked for all persons working in the sector—wage and salary workers, the self-employed and unpaid family workers. The primary source of hours and employment data is the BLS Current Employment Statistics (CES) program, which provides monthly survey data on the number of jobs held by wage and salary workers in nonfarm establishments, counting a person who is employed by two or more establishments at each place of employment. The CES also provides average weekly paid hours of production and nonsupervisory workers in these establishments. Weekly paid hours are adjusted to hours worked using data from the National Compensation Survey (NCS) for 1996 forward and data from the BLS Hours at Work survey, conducted for this purpose, prior to 1990. Between 1990 and 1995, weekly paid hours are adjusted to hours at work using a combination of NCS and Hours at Work survey data. The Office of Productivity and Technology estimates average weekly hours at work for nonproduction and supervisory workers using information from the Current Population Survey (CPS), the CES, and the NCS. Data from the CPS are used to estimate hours worked for farm labor, nonfarm proprietors, and nonfarm unpaid family workers. Using CPS information on employment and hours worked at primary jobs and all other jobs, separately, the BLS productivity measures assign all hours worked to the appropriate industrial sector. Hours for government enterprises are derived from the CPS, the CES, and the National Income and Product Accounts (NIPA) prepared by the Bureau of Economic Analysis (BEA) of the Department of Commerce. Output Business sector output is a chain-type, current-weighted index constructed after excluding from gross domestic product (GDP) the following outputs: general government, nonprofit institutions, and private households (including owner-occupied housing). Corresponding exclusions also are made in labor hours. Business output accounted for about 75 percent of the value of GDP in 2016. Nonfarm business, which excludes farming, also accounted for about 75 percent of GDP in 2016. Annual indexes for manufacturing and its durable and nondurable goods components are constructed by deflating current-dollar industry value of production data from the U.S. Bureau of the Census with deflators from the BLS. These deflators are based on data from the BLS producer price program and other sources. The industry shipments are aggregated using annual weights, and intrasector transactions are removed. Quarterly manufacturing output measures are based on the indexes of industrial production prepared monthly by the Board of Governors of the Federal Reserve System, adjusted to be consistent with annual indexes of manufacturing sector output prepared by BLS. Nonfinancial corporate output is a chain-type, current-weighted index calculated on the basis of the costs incurred and the incomes earned from production. The output measure excludes the following outputs from GDP: general government; nonprofit institutions; private households; unincorporated business; and those corporations classified as offices of bank holding companies, offices of other holding companies, or offices in the finance and insurance sector. Nonfinancial corporations accounted for about 50 percent of the value of GDP in 2016. Labor Productivity The measure describes the relationship between real output and the labor time involved in its production. Measures of labor productivity growth show the changes from period to period in the amount of goods and services produced per hour worked. They reflect the joint effects of many influences, including changes in technology; capital investment; level of output; utilization of capacity, energy, and materials; the organization of production; managerial skill; and the characteristics and effort of the work force.
-8-
Labor Compensation The measure includes accrued wages and salaries, supplements, employer contributions to employee benefit plans, and taxes. Estimates of labor compensation by major sector, required for measures of hourly compensation and unit labor costs, are based primarily on employee compensation data from the NIPA, prepared by the BEA. The compensation of employees in general government, nonprofit institutions and private households are subtracted from compensation of employees in domestic industries to derive employee compensation for the business sector. The labor compensation of proprietors cannot be explicitly identified and must be estimated. This is done by assuming that proprietors have the same hourly compensation as employees in the same sector. The quarterly labor productivity and cost measures do not contain estimates of compensation for unpaid family workers. Unit Labor Costs These measures describe the relationship between compensation per hour and labor productivity, or real output per hour, and can be used as an indicator of inflationary pressure on producers. Increases in hourly compensation increase unit labor costs; labor productivity increases offset compensation increases and lower unit labor costs. Presentation of the data The quarterly data in this release are presented in three ways: as percent changes from the previous quarter presented at a compound annual rate, as percent changes from the corresponding quarter of the previous year, and as index number series where 2009=100. Annual data are presented both as index number series and percent changes from the previous year. The index numbers and rates of change reported in the productivity and costs news release are rounded to one decimal place. All percent changes in this release and on the BLS web site are calculated using index numbers to three decimal places. A complete historical series of these index numbers are available at the BLS web site, www.bls.gov/data/home.htm, or by contacting the BLS Division of Major Sector Productivity (Telephone 202-691-5606 or email productivity@bls.gov). For a more detailed explanation of methodology see "Technical Information About the Major Sector Productivity and Costs Methods" at www.bls.gov/lpc/lpcmethods.pdf. Information in this release will be made available to sensory-impaired individuals upon request. Voice phone: 202-691-5606; Federal Relay Service number: 1-800-877-8339.
SOURCES: Output data are from the Bureau of Economic Analysis and the Census Bureau of the U.S. Department of Commerce; the Bureau of Labor Statistics, U.S. Department of Labor; and the Federal Reserve Board. Hours and compensation data are from the Bureau of Labor Statistics and the Bureau of Economic Analysis.
RELIABILITY: Productivity and cost measures are regularly revised as more complete information becomes available. The measures are first published within 40 days of the close of the reference period; revisions appear 30 days later, and second revisions after an additional 60 days. In the business sector, the third publication (second revision) of a quarterly index of output per hour of all persons has differed from the initial value by between –1.5 and 1.4 index points approximately 95 percent of the time. This interval is based on the performance of this measure between the fourth quarter of 1995 and the first quarter of 2017
No comments:
Post a Comment