EMBARGOED UNTIL RELEASE: 8:30 A.M. EST, Wednesday, December 12, 2018
BEA Release: Prototype Gross Domestic Product by County, 2012-2015
The U.S. Bureau of Economic Analysis (BEA) has issued the following news release today:
The U.S. Bureau of Economic Analysis (BEA) has issued the following news release today:

The Bureau of Economic Analysis released prototype statistics for gross domestic product (GDP) by county for 2012-2015. Combined with BEA’s county estimates of personal income, GDP by county offers a more complete picture of local area economic conditions.
In conjunction with their release, BEA is requesting feedback and comments on these prototype statistics to assist in improving their quality, reliability and usefulness.
"This is the first time the Bureau of Economic Analysis is providing GDP statistics for each and every county in the United States," said Secretary of Commerce Wilbur Ross."The prototype data addresses one of the last remaining gaps in economic knowledge, offering policymakers and businesses a new tool to inform their decision-making."
These prototype GDP statistics, which provide detail for 3,113 counties, include industry breakouts for private goods-producing industries, private services-producing industries, and the government and government enterprises industry group. These statistics represent another step forward in meeting BEA's long-standing goal of providing a more detailed geographic distribution of the nation's economic activity. County-level GDP statistics will assist analysts in the assessment of local economic performance and policymakers in the development of strategies to promote economic growth. They will also help answer important questions related to the size and condition of local area economies, industrial composition, and comparative growth trends.
GDP by county statistics provide a richer picture not only of the distribution of national economic output, but also of national economic trends and their manifestation at finer and alternative levels of geographic detail. They can be used to inform resource allocation decisions and support economic development strategies that target areas with the greatest need by identifying strengths and weaknesses of local economies. GDP by county statistics can also support research into understanding local economic dynamics, the longer-term impacts of different development strategies, and the effectiveness of incentive programs used to support these strategies.
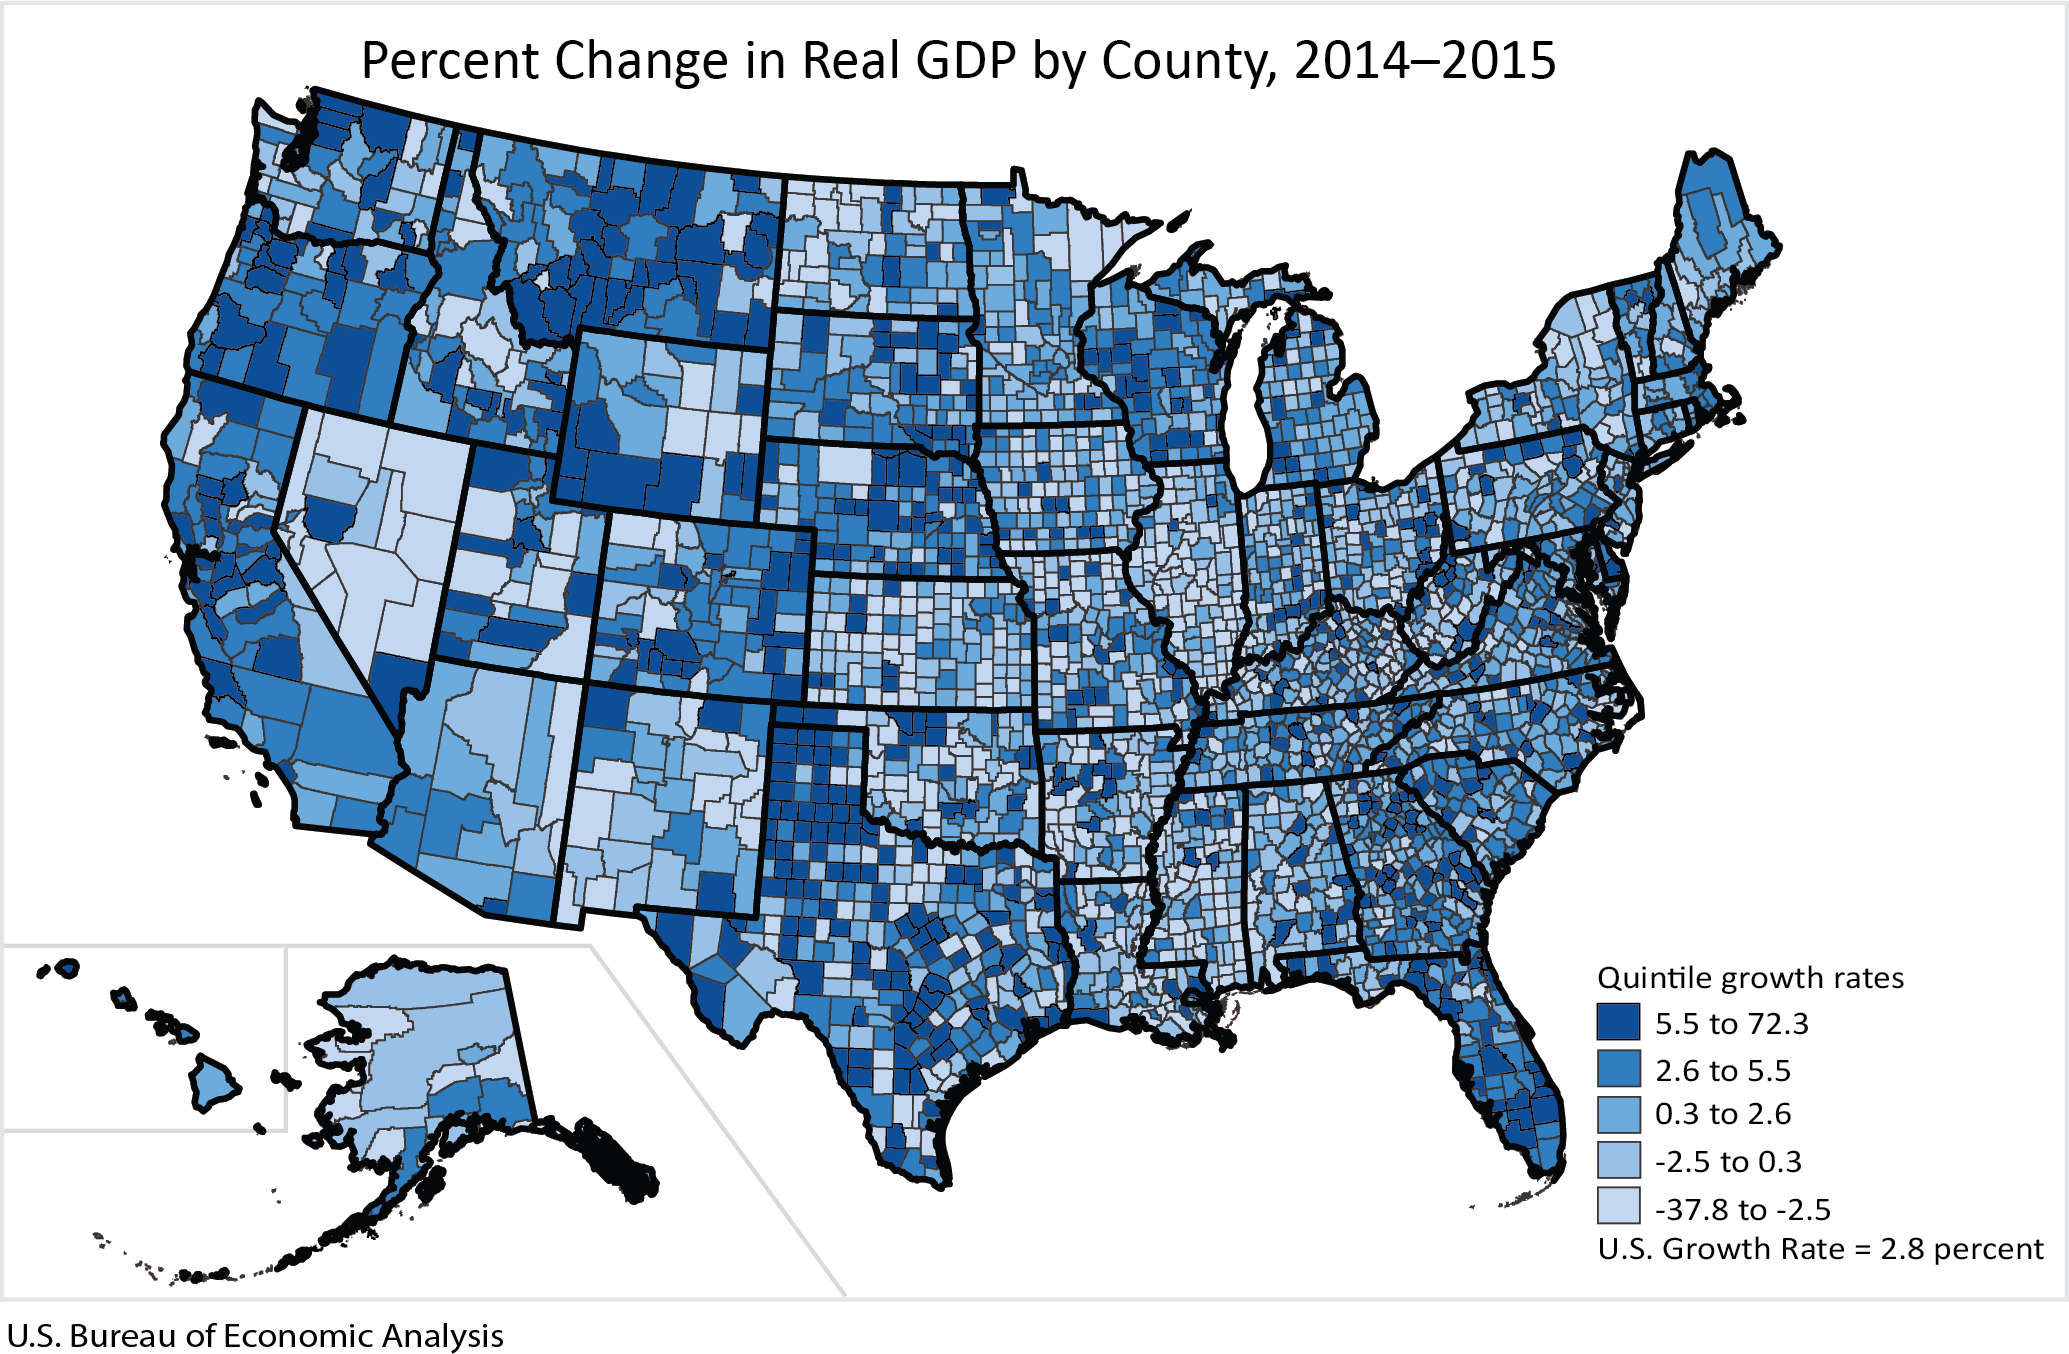
Highlights
In 2015, real (inflation adjusted) GDP increased in 1,931 counties, decreased in 1,159, and was unchanged in 23. Real GDP ranged from $4.6 million in Loving County, TX to $656.0 billion in Los Angeles County, CA.The full text of the release on BEA's website can be found at: https://www.bea.gov/news/2018/


