Read for results about Mesa
The Phoenix MSA continued to see robust year-over-year land sales volume growth rising 43 percent to just over $150 million across 26 transactions, totaling 204.5 acres.
Although total sales volume saw an increase, overall sales price per square-foot decreased to $30.32 as a result of developers purchasing less expensive land in the MSA’s periphery, namely Chandler ($15.44/SF), Gilbert ($7.90/SF) and Mesa ($13.49/SF).
Source: AZ Big Media
Report: Phoenix posts $4.97 billion in apartment sales in 2016
By all accounts, the Phoenix MSA multifamily market had an absolute banner 2016 investment year fueled, in large part, by both robust jobs and population growth.
The 1980’s built product has seen the greatest price per unit increase rising, on average, 18 percent above peak 2007 pricing to its current $90,384/unit.
In fact, 1980’s built product is the only product type to have risen above the 2007 peak.
Although total sales volume saw an increase, overall sales price per square-foot decreased to $30.32 as a result of developers purchasing less expensive land in the MSA’s periphery, namely Chandler ($15.44/SF), Gilbert ($7.90/SF) and Mesa ($13.49/SF).
Tempe saw the highest sales price per SF amount in the MSA, rising 26 percent year-over-year to $56.74 and followed by the City of Phoenix at $34.99 per-square-foot.
Home builders have been struggling with a whole host of issues from labor shortages, rising material costs and lack of available land, particularly in more urban core areas where people want to live.
Last, home builders are facing significant competition from multifamily developers/rehabbers luring, and keeping, would be homebuyers through high-end construction finishes and access to amenities.
While there is some concern about over-building, particularly among Class A multifamily properties, the reality is that Phoenix is still at a net deficit and needs more units to accommodate continued growth which, as it stands now, single-family has been unable to fill that new, net demand.
The Phoenix MSA continued to see robust year-over-year land sales volume growth rising 43 percent to just over $150 million across 26 transactions, totaling 204.5 acres.
Although total sales volume saw an increase, overall sales price per square-foot decreased to $30.32 as a result of developers purchasing less expensive land in the MSA’s periphery, namely Chandler ($15.44/SF), Gilbert ($7.90/SF) and Mesa ($13.49/SF).
Source: AZ Big Media
Report: Phoenix posts $4.97 billion in apartment sales in 2016
By all accounts, the Phoenix MSA multifamily market had an absolute banner 2016 investment year fueled, in large part, by both robust jobs and population growth.
On the jobs front, Phoenix area economic development officials worked overtime in luring a whole host of corporate/regional office relocations, tech/manufacturing company openings and existing business expansions.
Top job announcements include: [just to name a few] figures are projected not actual
- ADP’s new Tempe office to bring 1,500 jobs,
- Santander Consumer USA’s regional operations center in Mesa’s Fiesta District set to bring 1,000+ jobs,
- Orbital ATK’s Chandler expansion with 500 new jobs,
- Clearlink’s expansion into Downtown Scottsdale with 500+ jobs,
- Rogers Corp (NYSE: ROG) global HQ move to Chandler and
- Kudelski Group’s international HQ move to Phoenix
According to WalletHub’s analysis of the 150 biggest cities in the country, five (5) Phoenix MSA cities cracked the Top 20 of best places to find a job: Mesa not on the list
Scottsdale at No. 1,
Chandler at No. 7,
Tempe at No. 9,
Peoria at No. 11 and
Gilbert at No. 18.
In regards to population, although growing less than the halcyon days of the 1980/90’s, Phoenix MSA grew by nearly 2 percent to 4,565,900 in 2016.
Phoenix Market Metrics: By the Numbers
The MSA’s total sales volume (10+ unit properties) increased 28 percent, yearover-year, to a market record, $4.97 billion across 376 total transactions with 47,233 total units sold or 14 percent market velocity.
In fact, Phoenix’s market velocity rate has increased nearly 34 percent since 2013 due to substantial investor interest in value add sales.
Despite besting Phoenix’s 20 year new construction delivery average, 5,300 units, with 7,912 new units delivered in 2016, both average rent and occupancy increased for the MSA, by 7.8 percent to $955 and 0.5 percent to 95.6 percent respectively.
Mesa and Glendale claimed the top spots for the MSA in rent growth at 9.9 percent and 9.5 percent respectively, followed by Phoenix at 8.3 percent, Tempe at 6.3 percent and Scottsdale at 5.6 percent.
Although Scottsdale saw the lowest average rental rate percentage increase of the MSA, it still claims the top spot in actual average rent which at $1,241 is the highest in the region. In regards to occupancy,
Tempe was No. 1 at 96.2 percent despite being No. 2 for unit deliveries and once again bucking analyst expectations of a projected decrease in occupancy due to increasing supply.
Glendale came in at No. 2 with 95.8 percent occupancy, a 1.1 percent year-over-year increase
Phoenix and Mesa were tied for No. 3 with both increasing 0.6 percent to 95.6 percent and 95.5 percent respectively.
Scottsdale, the lone outlier, was the only city in the region to witness a small occupancy contraction of (0.3 percent) to its current 95 percent; due, in large part, to a 7.5 percent net increase in total supply.
Peak Pricing?
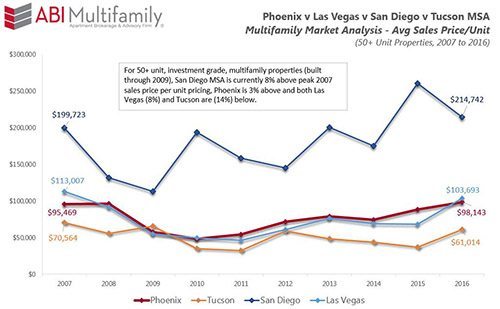
Phoenix, overall, is approximately 3 percent above peak 2007 pricing and still well below San Diego’s current $214,742/unit amount. The 1980’s built product has seen the greatest price per unit increase rising, on average, 18 percent above peak 2007 pricing to its current $90,384/unit.

Market comparison
In fact, 1980’s built product is the only product type to have risen above the 2007 peak.
- Pre-1980s built projects are second, in terms of previous peak-to-current price per unit appreciation, rising to $70,823 or (2 percent) below 2007’s peak,
- 1990-99 built projects are (4 percent) below 2007’s peak currently, $135,318 per unit
- 2000-09 built projects are (6 percent) below peak at $129,786 per unit.
Got Land?
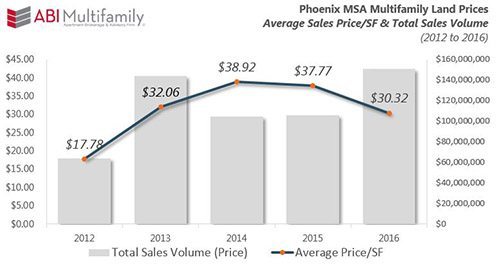
Phoenix MSA continued to see robust year-over-year land sales volume growth rising 43 percent to just over $150 million across 26 transactions, totaling 204.5 acres. Although total sales volume saw an increase, overall sales price per square-foot decreased to $30.32 as a result of developers purchasing less expensive land in the MSA’s periphery, namely Chandler ($15.44/SF), Gilbert ($7.90/SF) and Mesa ($13.49/SF).

Phoenix MSA Land Sales 2012 to 2016
The Road Ahead
IPhoenix multifamily’s greatest competitor, single-family home construction, although rebounding, is still far from normal. Home builders have been struggling with a whole host of issues from labor shortages, rising material costs and lack of available land, particularly in more urban core areas where people want to live.
Last, home builders are facing significant competition from multifamily developers/rehabbers luring, and keeping, would be homebuyers through high-end construction finishes and access to amenities.
While there is some concern about over-building, particularly among Class A multifamily properties, the reality is that Phoenix is still at a net deficit and needs more units to accommodate continued growth which, as it stands now, single-family has been unable to fill that new, net demand.


No comments:
Post a Comment