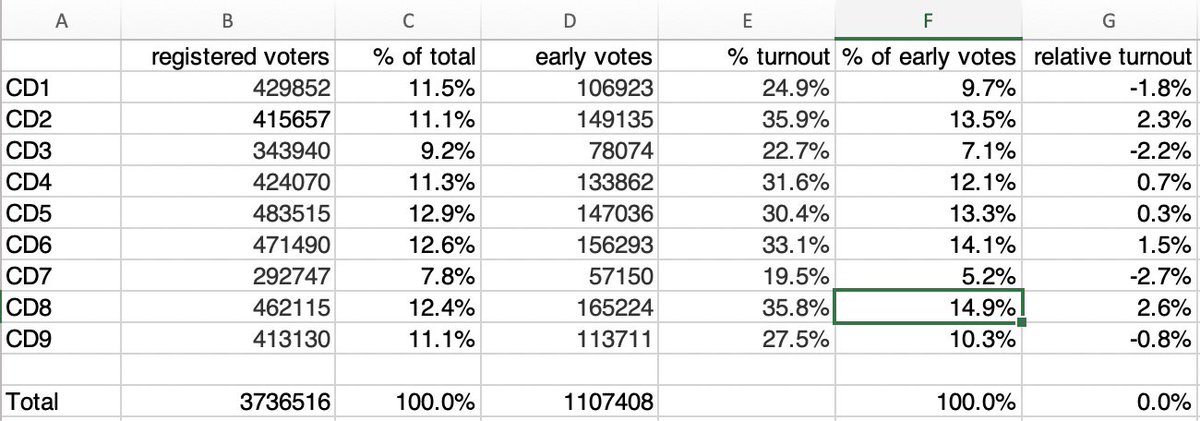
Thanks to the AZ Data Guru we can see the distribution patterns for percentage of early ballot returns that have been sent in - at least in one city here in Maricopa County Phoenix.
Your MesaZona blogger would love to get his hands-on an infographic like the one inserted below from Kate Gallego on AZ Data Guru's
Twitter feed: https://twitter.com/Garrett_Archer
Today's ballots bring us to approximately 56% of all ballots that we should expect to see.
- 18-34: 36k R 27% D 40% I 31%
- 35-44: 13k R 29% D 34% I 38%
- 45-54: 15k R 39% D 29% I 31%
- 55-64: 25k R 42% D 29% I 28%
- 65-74: 29k R 41% D 29% I 29%
- 75-84: 11k R 47% D 26% I 27%
- 85+: 2k R 49% D 27% I 27%

 .
.
_________________________________________________________________________
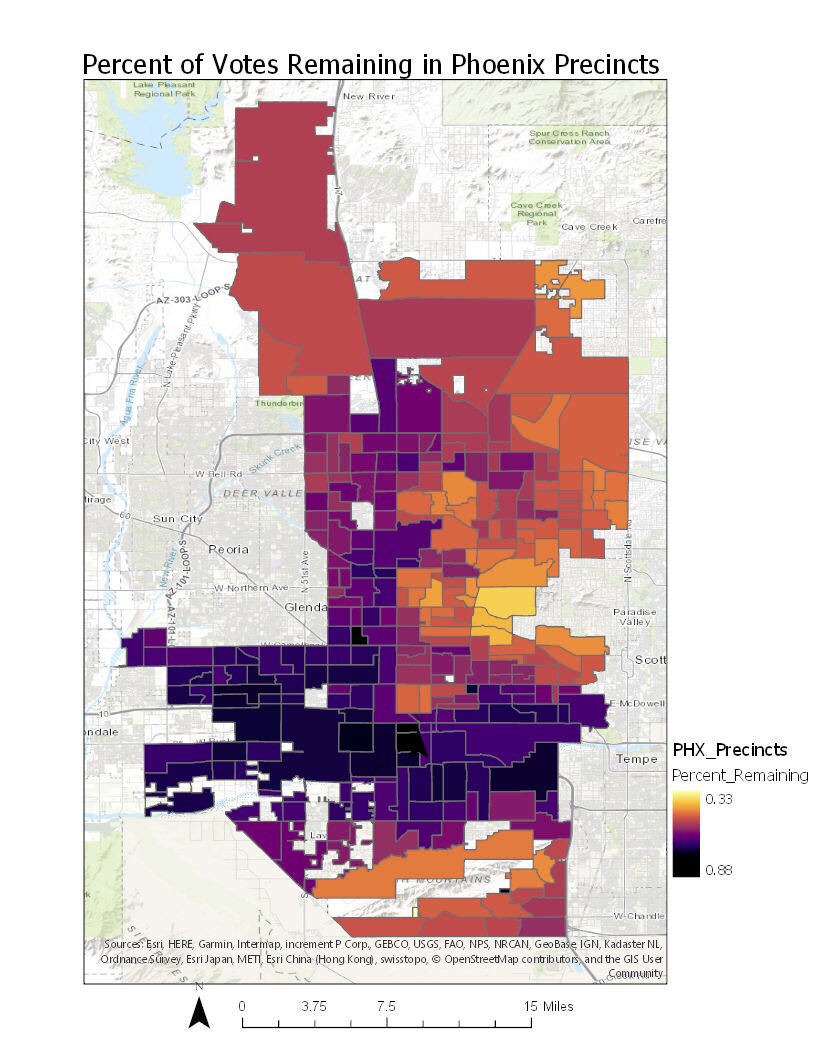
QUESTION: Notice where the concentrations of clusters where the voting percentages remaining are the highest: in the central city core.
Check out this spooky map showing the % of votes remaining in each City of Phoenix precinct.